System Flow Charts A modeling method that analysts may use to
230 likes | 542 Views
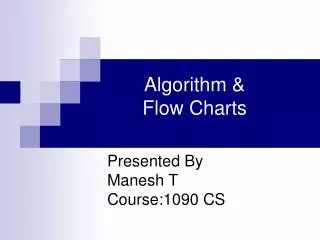
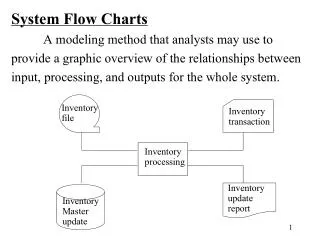
System Flow Charts A modeling method that analysts may use to provide a graphic overview of the relationships between input, processing, and outputs for the whole system. Inventory file. Inventory transaction. Inventory processing. Inventory update report. Inventory Master update.

System Flow Charts A modeling method that analysts may use to
E N D
Presentation Transcript
System Flow Charts A modeling method that analysts may use to provide a graphic overview of the relationships between input, processing, and outputs for the whole system. Inventory file Inventory transaction Inventory processing Inventory update report Inventory Master update
Function Decomposition Modeling Method A function decomposition provides a conceptual overview of all the activities an organization performs in support of its overall purpose. Business function Manufacture product Distribute product Market product R & D Advertising R & D Maintain operations Market analysis Production operations Maintain parts
Procedure Modeling Methods The modeling methods, such as HIPO diagrams, Nassi-Schneiderman charts, program flow charts, psuedocode and structured English, action diagrams, and structure charts, are used to help model the information system procedures that eventually become instructions that make up program logic. Program logic Refers to the way programs execute, sometimes called a program’s procedure model.
HIPO Diagram Modeling Method HIPO diagrams are used to hierarchically show the inputs, processing, and outputs of each processing module. A HIPO diagram usually consists of three separate and interrelated sets of diagrams : 1. A visual table of contents (VTOC) diagram 2. An Overview diagram 3. One or more detail diagrams HIPO VTOC Diagrams Identifies the major procedures performed by the system and the subordinate procedure necessary to successfully complete the major procedure.
NEW EMPLOYEE HIRING 1.0 System Procedure NEW EMPLOYEE DATA ENTRY 1.1 EMPLOYEE APPLICATION PROCESSING 1.2 DEPARTMENT PERSONNEL REPORTING 1.3 Subordinate Procedure CHECK & MATCH QUALIFICATION 1.21 PROCESS MATCHED REQUEST 1.22 Figure : VTOC for processing a payroll application
HIPO Overview Diagrams A HIPO diagram to depict each level of processing within the VTOC, with an overview diagram sometimes created for each module in the VTOC. HIPO Detail Diagrams A HIPO diagram that contains the specific steps involved in procedures identified in the overview diagram.
Nassi-Schneiderman Charts A procedure modeling method in which each type of control structure is used to specify the set of procedures required for a particular application using the three basic principles of good programming : sequence, selection, and iteration. Selection Sequence Iteration IF LOOP STATEMENT Instruction a FALSE TRUE Instruction a Instruction b BODY OF LOOP Instruction n
OPEN FILE DO WHILE THERE ARE RECORD TO BE ENTERED INPUT RECORD FROM TERMINAL VALIDATE RECORD VALID RECORD ? YES NO WRITE TO FILE WRITE TO ERROR FILE CLOSE FILES Example of Nassi-Schneiderman chart
Program Flow Charts A procedure diagram that uses graphical symbols to specify the logic of programming procedures that express sequence, selection, and iteration. START A , B Yes No A >= B A B STOP
Pseudocode Consists of instructions written in broken-English statements that are fundamentally equivalent to their counterparts in a particular computer language. Open the files Read a COMMISSION record Do until end of file Compute commission Print a detail line Read a COMMISSION record ENDDO Close the files End of program
Structured English A procedure modeling method similar in use to pseudocode, but less cryptic in its statement.
Structure Charts A structure chart (STC) is a graphical modeling method that depicts the procedure logic of programs in a basic format consistent with the layout of structured programs.
Structure chart Process Commissions Read Commission Record Process Commission Read Commission Record Print Special Letter Print Award List Calculate Commission
Conversion from DFD to Structure charts Course Description 2 Read Course Record Course Record Course Master Course Number Of Credits GPA. 4 Calculate GPA. Course Number 1 Read Grade Record 5 Print Student Report Grade Record Grade file Course Grade Student Report Card Student Number 3 Read Student Record Student Record Student Master Student DFD Level 0
Grade Point Average Course Grade Course Description 5.1 Format Student Name and Address line 5.2 Format Course Grade line 5.3 Format Grade Point Average line Student Name and Address Course Grade Line 5.4 Write Report Card line Grade Point Average Line Name and Address Line Student Report Card Child diagram
Produce Student Report Card Prepare Student Report Card Read Grade Record Read Course Record Read Student Record Calculate Grade Point Average Print Student Report Card Format Course Grade Line Format Grade Point Average Line Write Report Card Line Format Student Name and Address Line A structure chart for producing student report cards