Download
1 / 36
360 likes | 519 Views
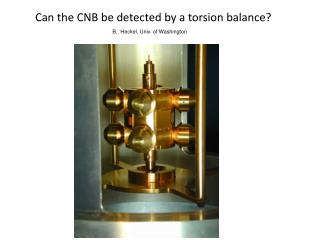
Development of a high-sensitivity torsion balance to study the thermal Casimir force (and more..) Woo-Joong Andy Kim Sept 22, 2011 Department of Physics Seattle University. It all starts from a simple idea. Casimir Force. Macroscopic effects of quantum fluctuations.

E N D
Development of a high-sensitivity torsion balance to study the thermal Casimir force (and more..) Woo-Joong Andy Kim Sept 22, 2011 Department of Physics Seattle University
Casimir Force • Macroscopic effects of quantum fluctuations • Scaling law distinct from the gravitational and electric forces • Retarded van der Waals interaction at large separations. • The force can be re-derived from the Lifshitz formula.
Force-distance measurements • Simple force-distance measurements using an AFM or a torsion balance • Two metal plates facing each other and brought closer to separations down to submicron meter. • Due to experimental difficulty with parallelism, a sphere-plane configuration is often employed. • What are distinct types of interaction forces one can expect to observe from a measurement? ✔ ✔
Patch force (Fpatch) • Exists despite that the electric forces are minimized with contact potentials may not be completely nullified [1]. • Must be distinguished from the actual forces of thermal and quantum fluctuations (e.g. Casimir/Lifshiz force) • Different models of patch force have been discussed, but it is not very clear how to apply a particular model for a given experiment [3-5]. • In a realistic experiment, only the sum is measured. At the minimized condition V=Vm, [1] W. J. Kim and U. D. Schwarz, J. Vac. Sci and Tech. B 28 C4A1 (2010). [2] W. J. Kim et al., PRL 103, 060401 (2009); PRA 81, 022505 (2010). [3] R. O. Behunin et al. arXiv: 1108.1761 (2011). [4] B. C. Stipe et al., PRL 87, 096801 (2001) N. A. Burnham et al, PRL 69, 133 (1992) [5] A. Naji et al., PRL 104, 060601 (2010).
Experimental: How do we measure it? Feedback plates Pivot point V0+δV Casimir plates V0-δV PID controller Generates δV PZT actuator 667 nm Diode Laser Quadrant photodetector Proportional-Integral-Derivative (PID) controller puts out correction voltage δV, which is proportional to a force exerted on test plates.
Just remember.. Force is directly proportional to SPID SPID=SDC+δV Contains distance-dependent force, such as
Acquisition of experimental data SPID 0 V
Curvature analysis I Electrostatic calibration d0 allows to assess the absolute distance Interesting to verify if d0 coincides with the actual distance e.g. Prof. H. B. Chan’s on-chip device. • Parabola curvature analysis • Calibration factor () • Absolute distances (d)
Contact potential analysis II Very important! Vmis not necessarily constant. In fact, it may change with distances [1] W. J. Kim, M. Brown-Hayes, D. A. R. Dalvit, J. H. Brownell, and R. Onofrio PRA 78 020101 (R) (2008)
[2] de Man, K. Heeck, and D. Iannuzzi. PRA 79 024102 (2009); de Man, K. Heeck, R. J. Wijngaarden, and D. Iannuzzi. J. Vac. Sci and Tech. B 28 C4A25 (2010). [3] W. J. Kim, A. O. Sushkov, D. Dalvit S. K. Lamoreaux. PRL 103, 060401 (2009)
Measured range from 100 μm to 100 nm: 3 orders of magnitude Most AFM measurements: 100-500 nm
[4] G. Torricelli, I. Pirozhenko, S. Thornton, A. Lambrecht, and C. Binns. EPL 93 51001 (2011). [5] G. Torricelli et al. PRA 82 010101 (R) (2010) [7] S. E. Pollack, S. Schlamminger, and J. H. Gundlach. PRL 101, 071101 (2008). [6] Q. Wei et al., PRA 81, 052115 (2010).
V Contact potential difference (CPD) • CPD cannot be measured with a voltemeter! • Kelvin probe microscopy (KPM) can measure this. Essentially, this is a minimizing condition for a force between two plates • Same as work function? Not really.. • A combination of work function, surface potential patches (spatially varying), charging effects, and wire connections..
Naïve picture of an ideal situation Perfectly smooth, homogeneous samples Unique values of capacitance and contact potential When electrostatic force is minimized, it’s always nullified
More realistic picture of the situation Distance-dependent contact potentials! Fpatch(d) Distance-dependent Electric force even Vm! Electrostatic force is no longer nullified AND It could interfere with other distance-dependent forces of great physical interest The situation becomes more complicated in a real experiment
The CPD is an old problem… GP-B/LISA/LIGO Ion-trap/neutral atom exp [1] Bridgman. Phys. Rev 14, 306 (1919). [2] Dowling. Phys. Rev. 25, 812 (1925). [3] Dowling. Phys. Rev 31 244 (1928). [4] B. R. Rose, Phys. Rev 44 585 (1933). [5] C. W. Oately. Proc. Royal Society of London: Math and Phys. 155 218 (1936). [6] H. H. Uhlig. J. Appl. Phys. 22 1399 (1951). Contact potential variation at different temperature/CPD between the solid and liquid phases [1-3]. Measurements on contact potential difference between faces of copper single crystals. Found CPD greater than 463 mV. “This is much great than was anticipated for a symmetrical cubic crystal and indicates desirability of extending the investigation to other crystals” [4] Volta potentials of the Copper-Nickel alloys and several metals in air. Test of temporal stability [6] Patch effect being the largest systematic errors for Gravity probe B: PRL 106 221101 (2011). Physics 4, 66 (2011) http://physics.aps.org/articles/v4/66:” All that is gold does not glitter”
Noncontact atomic force microscopy (NC-AFM) Fluctuation induced friction measurements (in the early 90s) Particle physics: Freely falling electrons under the influence of gravity (in the 70s) [1] F. Bocquet, L. Nony, C. Loppacher, and T. Glatzel. PRB 78 035310 (2008) short range electrostatic force/ variation of contact potential with respect to z distance as well as lateral position. [2] G. H. Enevoldsen, T. Glatzel, M. C. Christensen, J. V. Lauritsen, and F. Besenbacher. PRL 236104 (2008) Atomic scale surface potential variation using KPM [3] M. Lucchesi, G. Privitera, M. Labardi, D. Prevosto, D. Capacciloli, P. Pingue. arXiv:0901.0500 (2009) Repulsive/attractive electric force depending on CPD. Review paper: W. J. Kim and U. D. Schwarz, J. Vac. Sci and Tech. B 28 C4A1 (2010)
Distance-Dependent Forces Casimir force due to quantum vacuum fluctuation Coulombian force due to spatial fluctuation of patches Some critical questions we should be asking: How do we distinguish between the two? Could the surface effect ever be accurately and precisely taken into account in a precision force measurement? If not, could one ever observe a pure Casimir force in a realistic experiment employing a pair of real samples that necessarily bear defects and inhomogeneity to some degrees? Do you have any suggestions?
Our experiment Nano rotator (360 rotation) Position-sensitive Photodetector (PSPD) 3-axis position stage with peltier (TEC) cooler Pump system: Diffusion Roughing (not shown)
Schematic of our torsion balance Feedback plates Pivot point V0+δV F Casimir plates V0-δV PID controller Generates δV PZT actuator 667 nm Diode Laser Quadrant photodetector Proportional-Integral-Derivative (PID) controller puts out correction voltage δV, which is proportional to a force exerted on test plates.
Torsion balance Tungsten fiber Detection Mirror Damping magnetc
Preliminary data for feedback control Time (sec) Photodetector (V)
Sensitivity Tungsten fiber d=76 μm has been etched in copper solution by electrochemistry and is now firmly held in place. The fiber length is currently set to l=20 cm. The torsion has mass m=97.3 g, and its thermal angular fluctuations for the swinging (gravitational) pendulum mode is This is much smaller than the torsional angular fluctuation, which comes from angular restoring torque given by Here, α is the torque coefficient similar to “spring constant” and is an intrinsic quantity for our tungsten fiber. α=2.9x10⁻⁶ N m/rad
Based on fluctuation-dissipation theorem, the rms force noise. The angular resolution of the photodiode is estimated to be δθ=0.5 mV/μrad. This is based on 6 mm photodiode diameter with max output voltage of 10 V at a distance of 30 cm from the detection mirror. Conservative estimate for force resolution, if the angular tilt of 1 μrad is assumed, is about 30 pN. This is equivalent to the Casimir force at a few μm separation in a typical sphere-plane configuration. The entire balance will be put together in vacuum inside a bell jar. Both roughing and diffusion pumps have been installed. Target pressure 10-7 torr to be achieved soon.
Construction of closed-loop PZT Applied voltage (V) Actual displacement (arb unit)
Michelson’s interferometer for PZT calibration Independent PZT calibration using a He-Ne laser (632.816 nm) Vibration isolation table (floating)
PZT sweep Fringe changes Full period= λ/2 Relate the period to a change in voltage applied to PZT to obtain a calibration factor. (630 nm/V) Visibility over 90% achieved.
Research directions 1. Precision electric force microscopy: (a) Look for size-dependent contact potentials, force constant, and surface patch forces at large distances. (b) Employ KPM to collect information about local patches. (c) Investigate the behavior of electrostatic scaling exponent over many order of distances. 2. Thermal Casimir force revisited: How do we properly separate the two contributions (Fcas & Fpatch)? Extend the measurement range to 10 μm or more
3. The Casimir force in graphene sample M. Bordag et al., PRB 74 205431 (2006) M. Bordag et al., PRB 80 245406 (2009) Bo. E. Sernelius EPL 95 57003 (2011) V. Svetovoy et al., arXiv:1108.3856v1 Large-area synthesis seems feasible now!!! Science 324 1312 (2009) We are currently working with Dr. Daniil Stolyarov at Graphene Laboratories to deposit a thick layer of graphene flakes on Si/SiO2 substrate by polymer free method (Testing stage).
Conclusion Reported recent developments of a torsion balance at Seattle University. Critical investigations on how to understand the relevant contributions in the total force measured from a force-distance experiment even at the minimized electrostatic condition. That is, Fcas VS. FPatch The problem is not only ours, but also in many other research fields in physics: GP-B, LISA/LIGO, ion trap/neutral atom exp, and NC-AFM, and perhaps more. This unique problem is likely to bring together scientists from different fields of physics.
Acknowledgements • Murdock Charitable Trust • Research Corporation (SI-CCSA) • Startup funds made possible by the College of Science and Engineering at Seattle University • University of Washington NanoTech User Facility (NTUF) • The project is completely to be carried out by undergraduate students and myself: Todd Graveson and Charlie Rackson Special thanks to: Dr. Diego Dalvit Dr. Roberto Onofrio Dr. Cheol Park Dr. Steve Lamoreaux