Download
1 / 47
480 likes | 642 Views
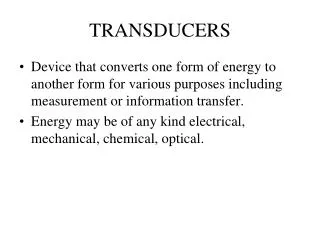
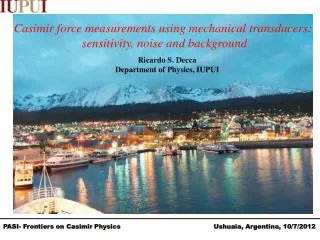
Casimir force measurements using mechanical transducers: sensitivity, noise and background. Ricardo S. Decca Department of Physics, IUPUI. Attractive interaction. Dominant electronic force at small (~ 1 nm) separations Non-retarded: van der Waals Retarded: Casimir. z.

E N D
Casimir force measurements using mechanical transducers: sensitivity, noise and background Ricardo S. Decca Department of Physics, IUPUI
Attractive interaction • Dominant electronic force at small (~ 1 nm) separations • Non-retarded: van der Waals • Retarded: Casimir z No mode restriction on the outside
In principle, a simple task • System to measure the interaction -Mechanical oscillators with soft springs. -It actually is a transducer, and either a deflection (linear or angular)or a frequency shift is measured. -A calibration against a known interaction is needed. An electrostatic interaction between the bodies is used. -It needs to be free of systematic effects. But nobody succeeds. • System to measure the separation between bodies -Two-color interferometer yields absolute positioning. -One point needs to be obtained in a different way. • Characterization of the system and samples • -Measurement of all parameters involved. • -Minimization of backgrounds. • -Characterization of the materials used • Comparison with theory
Collaborators Daniel López Argonne National Lab Ephraim Fischbasch Purdue University Dennis E. Krause Wabash College and Purdue University Valdimir M. Mostepanenko Noncommercial Partnership “Scientific Instruments”, Russia Galina L. Klimchitskaya North-West Technical University, Russia Jing Ding, Brad Chen IUPUI Edwin Tham, Hua Xing Vladimir AksyukCNST/Univ. of Maryland Diego DalvitLos Alamos National Lab Peter MilonniLos Alamos National Lab Francesco IntravaiaLos Alamos National Lab Paul DavidsSandia National Lab Il Woong Jung Argonne National Lab NSF, DOE, LANL, DARPA Funding
Outline • 1.- Review of experimental results • 2.- Characteristics of a system • 3.- Measurement of the interaction • 4.-Measurement of the separation • 5.- Sample preparation, and characterization • 6.- Comparison with theory • 7.- Effects of environment • 8.- Low temperature measurements • 9.- Potential approaches to get better results? • 10.- Summary
Review of experimental results Observation of the thermal Casimir force • A. O. Sushkov, W. J. Kim, D. A. R. Dalvit & S. K. Lamoreaux • Nature Physics 7, 230–233 (2011)
Review of experimental results Roberto Onofrio's group at Dartmouth College G. Bressi, G. Carugno, R. Onofrio, G. Ruoso, "Measurement of the Casimir force between Parallel Metallic Surfaces", Phys. Rev. Lett.88 041804 (2002)
Review of experimental results A. Roy, C.Y. Lin and U. Mohideen, "Improved precision measurement of the Casimir force," Physical Review D, Rapid Communication, Vol. 60, pp.111101-05 (1999).
Review of experimental setups Measurement of dispersive forces between evaporated metal surfaces in the range below 100 nm P.J. van Zwol, G. Palasantzas, M. van de Schootbrugge, J. Th. M. De Hosson
Review of experimental results D. Chavan, G. Gruca, S. de Man, M. Slaman, J. H. Rector, K. Heeck, and D. Iannuzzi, Ferrule-top atomic force microscope, Rev. Sci. Instrum. 81, 123702
Review of experimental results Quantum Mechanical Actuation of Microelectromechanical Systems by the Casimir Force; Chan, Aksyuk, Kleiman, Bishop, Capasso Science 291, 1941 Nonlinear Micromechanical Casimir Oscillator; Phys. Rev. Lett. 87, 211801
Review of experimental results Effect of hydrogen-switchable mirrors on the Casimir force Iannuzzi, Lisanti, and Capasso Proc. Nat. Acad. of Sci. 101, 4019
Review of experimental results • More yet! • Lateral Casimir effect • Measurements on corrugated samples • Phase-change materials • Indium-Tin Oxide (ITO)
Characteristics of a system - 5 axis (xyz, rock and tilt) stepper motor drive - 3 axis (xyz, not seen) closed loop 70 micron range piezo stage - Two color interferometer integrated into the system for continuous absolute position measurement - Total position stability control better than 0.2 nm - Base pressure: ~ 1x10⁻⁷Torr - Mounted in an active damping control air table - Passive magnetic damping on floating system
Characteristics of a system Optimal strategy: Decrease a, increase Q, work at fo, and low T Not considering intrinsic losses Newell(1986)
Characteristics of a system What ist? Noise (thermal, vibrational, 1/f), actual forces (known and unknown: Electrostatic, patch effects, Casimir, gravitational, …) f(Hz)
Characteristics of a system Lately, we have changed the setup: the sphere is on the oscillator, the plate is on top. -Different sample (nanostructured), cannot be made on the oscillator’s plate. -Larger sample, requires different deposition.
Measurement of the interaction Determined by: -Looking into the response of the oscillator in the thermal bath. Or -Inducing a time dependent separation between the plate and the sphere (preferred).
Measurement of the interaction Errors Minimum values Frequency: 6 mHz ~28 mHz (at 750 nm) b2/I: 0.0005 mg-1 1.2432 mg-1 R: 0.2 mm 150 mm
Measurement of the separation zg zg= (2172.8 ± 0.1) nm, interferometer zi= ~(10000.0s ± 0.2) absolute interferometer zo= (8162.3 ± 0.5) nm, electrostatic calibration b = (207 ± 2) mm, optical microscope Q = ~(1.000 ± 0.001) mrad zo is determined using a known interaction zi, Q are measured for each position
Measurement of the separation Electrostatic force calibration
Measurement of the separation Electrostatic force calibration z = 3.5 mm
Measurement of the separation … and time Electrostatic force calibration Vois constant as a function of separation… Otherwise, Vo needs to be determined at each point 10 x 10 grid, 5 mm pitch
Measurement of the separation Electrostatic force calibration -After measuring the deflection (expressed as force here), we adjust for the unknown separation. -The figure shows the DFe for the optimal and one off by 1.5 nm
Measurement of the separation Interferometer (Yang et al., Opt. Lett. 27, 77 (2005) lLC =(1240 +/- D) nm (low coherence), lCW1550 nm (high coherence) in Readout Mirror (v ~ 10 mm/s) x Dx = zi -Problems in lack of parallelism (curvature of wavefronts) are compensated when subtracting the two phases -Gouy phase effect is ~ , and gives an error much smaller than the random one
Measurement of the separation Interferometer (Yang et al., Opt. Lett. 27, 77 (2005) lLC =(1240 +/- D) nm (low coherence), lCW1550 nm (high coherence) input Readout (independent at each wavelength) Mirror (v ~ 10 mm/s) x Dx = zi zi -Phases obtained doing a Hilbert transform of the amplitude -Changes in D (about 2 nm) give different curves. Intersections provide Dx -Quite insensitive to jitter. Only 2DDx’/(lCW)2 Instead of 2Dx’/lCW
Sample preparation and characterization -Au on the sapphire sphere is deposited by thermal evaporation. -Au on the oscillator is also deposited by thermal evaporation but on large samples it is deposited by electroplating (on Si[111]) -Samples are characterized by measuring resistance as a function of temperature, AFM measurements and also ellipsometry in the electrodeposited sample. -The sample to be used is mounted as quickly as possible into the system, baked to ~ 60 oC for ½ hour (not the oscillator) (10x10 mm2) ~ 20 nmpp
Sample characterization -r vs T and spectroscopic ellipsometry (190 nm to 830 nm) used to determine optical properties. -Both methods indicate a rather good Au sample
Sample characterization -Measured real and imaginary parts of the dielectric functions (red circles) are similar to published values (Palik, black squares) -It was checked that either can be used, given the same results.
Sample characterization Both samples on the left panel. Difference between them on the right one
Comparison with theory Roughness corrections vi: Fraction of the sample at separation zi Roughness corrections are ~0.5% to the Casimir interaction at 160 nm
Comparison with theory Finite conductivity and finite temperature
Comparison with theory Bentsen et al., J. Phys. A (2005)
Comparison with theory PRD 75, 077101 • Dark grey, Drude model approach • -Light grey, plasma model approach
Effects of environment: Vo For the residual effects of the patch potentials, it has been noted that their influence does not average to 0, since . Hence in the effective area of separation, there could be a residual electrostatic force. For the size of our sphere, at large separations, we do not see it. Is it possible for it to be there at short separations? Why do we see Vo constant? (Many others don’t) We can give an answer to the first question:
Effects of environment: Vo The capacitance is measured as arising from a contribution from the sphere and the plate plus a small, constant parasitic capacitance.
Low temperature measurement Setup schematic Also at T = 0K dissipation will be reduced LHe can Springs Low pressure He can Magnet Experimental space (with positioning stage)
Low temperature measurement lLC =(1240 +/- D) nm lCW1550 nm Readout x Dx = zi Measured error is ~ 5 nm. Mechanical vibrations And problems with the interferometer Characterization When compared with previous measurements, the error in frequency is ~ 30 times larger at 1.5 K and ~ 40 times larger at 4.2 K and 77 K, yielding an increased error in PC
Low temperature measurement Room temperature Frequency shifts, Q increases, 77K … Noise increases! f(Hz) f(Hz)
Low temperature measurement Results Measurements at 1.5 K seem to have the lowest noise All data seem to coincide with the room temperature measurements The error on the low T measurement, el (400 nm) = 5 mPa is larger than the difference between the Drude and plasma models of 2.4 mPa This statement holds true at all temperatures and separations investigated
Summary • Measurement of the Casimir force, done with different mechanical • transducers • Our MTO used as example for minimum detectable force, SNR, etc • Description on system characterization • Possibilities for the future?