Download
1 / 16
160 likes | 224 Views
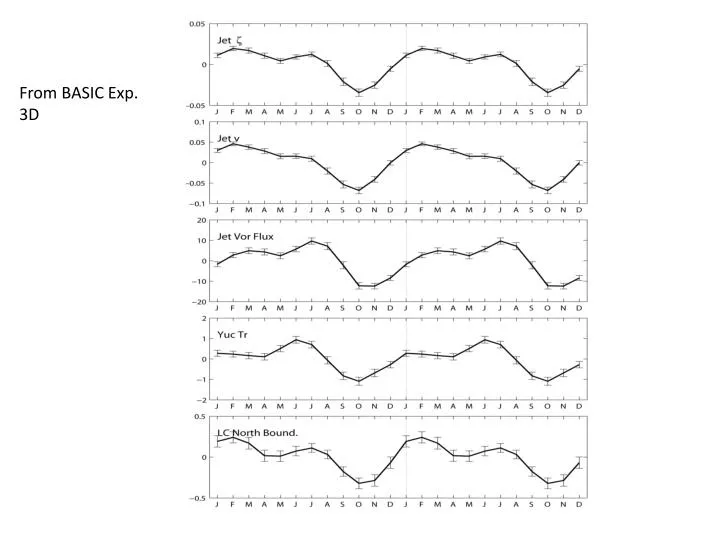
From BASIC Exp. 3D. Jet Ro(zeta/f), v at Yucatan Channel v.s . the extension of Loop Current (actual b in latitude) zeta/f : open triangle and solid line, v: circle and dash line. Bottom panel: vorticity flux vorticity is the leading term to determine the extension of the loop:

E N D
Jet Ro(zeta/f), v at Yucatan Channel v.s. the extension of Loop Current (actual b in latitude) zeta/f : open triangle and solid line, v: circle and dash line. Bottom panel: vorticity flux vorticity is the leading term to determine the extension of the loop: larger vorticity--> larger Loop
The monthly mean Sea Level Pressure from NCEP. (Top, Jan) January high on U.S continent. (Bot, July) Typical Azore high on Atlantic Ocean. The strength of the wind can also tell from the gradient of the contour in GOM and Carib. Carib is stronger than GOM.
AVISO eof1, eof2 eof1 is the shedding mode, and the eof2 is the extension mode. See the ensemble result of page 7.
AVISO eof3, eof4 eof3 represents the March (weaker) shedding mode. eof4 is the baroclinic mode
Ensemble Loop Current Cycle (Only the larger event (16 out of 24) are selected) of SSHA from AVISO. Original (left), eof1 (mid) and eof2 (right). Eof1: shedding mode Eof2: extension mode
Observed Loop Current shedding period order After 1994 (number 26), the shedding period seems shift to be shorter.
Corr. between WSC, WU, WV & AVISO Loop Current Northern Boundary (top) & Yucatan Top 800m Transp. in 3D
WUSURF in Carib WSC in Carib
90d LP Yucatan transp (black) & Sverdrup transp (top), WSC(mid), WU (bot) in the Caribbean Monthly ensemble results Note: Yucatan transp is top 800m, instead of total depth which is shown in slide#1
Monthly regression between Yucatan transp. & zonal windstr (WSC) • YUCtr=a+b*WU (zonal windstress) • YUCtr=a+b*WSC (WSC) • Repeat for each month • WU and WSC are normalized by its standard deviation (printed) • Plotted “b”, meaning that change of 1 std’s variable, how much will YUCtr change • YUCtr=a+b*WU+c*WSC
http://www.ldeo.columbia.edu/res/pi/NAO/ http://www.cpc.ncep.noaa.gov/products/precip/CWlink/pna/JFM_season_nao_index.shtml The lower fig shows standardized seasonal mean NAO index during cold season (blue line), constructed by averaging the daily NAO index for January, February and March for each year. The black line denotes the standardized five-year running mean of the index. Both curves are standardized using 1950-2000 base period statistics.The Positive NAO index phase shows a stronger than usual subtropical high pressure center and a deeper than normal Icelandic low. The negative NAO index phase shows a weak subtropical high and a weak Icelandic low. When NAO is negative, the winter easterly winds over the Caribbean Sea is weak, and the slide#10 wind has basically only one strong summertime easterly wind. – i.e. mono-modal and not bimodal. In that case, it is likely that the corresponding transport is also mono-modal, and the seasonal shedding may tend to be also mono-modal with preference in late summer only. This is consistent with Leipper (1970; JGR, 75, 637-657) whose 1965/1966 LC shows intrusion from spring through summer (Aug; see his fig.14).
http://www.cgd.ucar.edu/cas/jhurrell/nao.stat.winter.html Winter (December through March) index of the NAO based on the difference of normalized sea level pressure (SLP) between Lisbon, Portugal and Stykkisholmur/Reykjavik, Iceland since 1864. The SLP anomalies at each station were normalized by division of each seasonal mean pressure by the long-term mean (1864-1983) standard deviation. Normalization is used to avoid the series being dominated by the greater variability of the northern station. Positive values of the index indicate stronger-than-average westerlies over the middle latitudes Maul and Vukovich [1993] found generally stronger transport in summer (their figs.5, 7a,b). For 1979-1981, transport is unimodal (max in Jun, min in Dec/Jan), but for 1984-1985 and 1987 transport is max in Aug and a minor max in March, min in Dec and minor min in May – i.e. more like bimodal. The Loop Current and volume transport are also more in phase, bimodal, and transport and position tend to have more semiannual energy. Thus the volume transport undergoes a significant change in the phase of its annual cycle after 1985 as compared with 1977-1984. The lack of a bimonality prior to 1985 may be related to –veNAO when winter easterlies tend then to be weaker, and therefore cannot force the late-winter (i.e. March) minor-max in transport. After 1985, the +veNAO can force bimodality by making the late-winter minor-max transport more apparent. Maul and Vukovich [1993] tend to agree with Molinari et al [1977, Science, 198, 505-507] that max LC intrusion is in winter, not in summer as Leipper [1972] found.