Exp. 13:
Exp. 13: . CALCULATION, CHROMATOGRAPHIC, AND SPECTRAL APPLICATIONS. Objectives:. To review common laboratory calculations. To learn green chemistry calculations. To review how to use the calculated values to reach conclusions. LIMITING REAGENT & THEORETICAL YIELD.

Exp. 13:
E N D
Presentation Transcript
Exp. 13: CALCULATION, CHROMATOGRAPHIC, AND SPECTRAL APPLICATIONS
Objectives: • To review common laboratory calculations. • To learn green chemistry calculations. • To review how to use the calculated values to reach conclusions.
LIMITING REAGENT & THEORETICAL YIELD • Mass RCT Moles RCT (using MWrct) • Moles RCT Moles PROD (using stoichiometry) • Moles PROD Mass PROD (using MWprod) • Determine limiting reagent. • Theoretical yield is always in the units of GRAMS of PRODUCT!
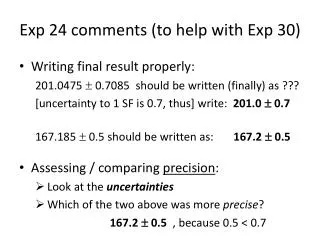
PERCENT YIELD Percent yield = ACTUAL PRODUCT MASS (g) X 100 THEORETICAL YIELD (g)
GREEN CHEMISTRY CALCULATIONS • Green chemistry calculations are used to determine how “environmentally friendly” your choice of reagents, solvents, and conditions were. • This includes ATOM ECONOMY, EXPERIMENTAL ATOM ECONOMY, AND “Eproduct”.
ATOM ECONOMY • Atom economy is based on the efficiency of reactant atoms converted to product atoms. Q: Were ALL of the reactant atoms converted to product atoms? • Any atoms of the reactants that did NOT appear in the product structure were converted to side products or waste. • Sometimes the side products and waste generated is harmful to the environment. • For this reason, an experiment should be designed to minimize the generation of waste and unnecessary side products.
ATOM ECONOMY Atom economy = MW desired product * 100 S MW reactants • Atom economy is based on which reactants were selected to make the product. • It assumes that the reactants were used in equivalent amounts, meaning that no excesses of any reactant were used. • The closer the atom economy is to 100%, the better!
EXPERIMENTAL ATOM ECONOMY Experimental atom economy = theoretical yield of product (g) * 100 S mass reactants • Q: Did we use only the amount necessary to generate the product? • Sometimes an excess of one reactant is used in order to drive the reaction to completion. For this reason, the experimental atom economy is calculated. • Experimental atom economy is a more precise measure of efficiency than the atom economy, since it takes into account the mass of each reactant used.
“E” PRODUCT “Eproduct”= (% yield X % experimental atom economy) 100 • “Eproduct”is the ultimate measure of efficiency, since both the conditions used and the amount of product that resulted under those conditions is taken into account. • “Eproduct”is a number, not a percentage! • The higher “Eproduct”is, the better!
IMPROVING EFFICIENCY… • An efficient reaction would have 100% Atom Economy and 100% Experimental Atom Economy. • One could improve the efficiency of a reaction by adjusting the conditions of a reaction in an effort to improve either of these values, such as: • Use different reactants to form the product (AE) • Use different amounts of reactants to form the product (EAE).
COST ANALYSIS • Cost per synthesis: total the cost of all reactants, solvents, and catalysts used to perform the synthesis. • Cost per gram: divide the cost per synthesis by the actual weight of product in grams.
HPLC and TLC Chromatography • Introduced in Experiments 4 and 5. • Difference between ANALYTE POLARITY and SOLVENT POLARITY. • UV detector is used in both. In order to be detected, compounds must be UV active. • Most solvents used in TLC and HPLC are not UV active, therefore do not appear on the TLC plate or in the HPLC chromatogram!
IR SPECTROSCOPY • Introduced in Experiment 10. • Base values are given in correlation tables. • Actual values are reported from actual spectrum • Don’t ever mention sp3 CH when using IR spectroscopy to differentiate between reactants and products! They are too common!
MELTING POINT ANALYSIS • Introduced in Experiment 7. • Detects all impurities! • Recorded as Ti-Tf range. • Pure = matches literature mp EXACTLY! • Impure = lower Ti, higher DT!
For Next Lab… • No pre-lab notebook required!