Insight into Cattle Feeding Industry and Practices
140 likes | 168 Views
Discover the cattle feeding industry with insights on states, feedyards, and practices. Learn about average capacity, daily intake, manure handling, and water quality threats. Stay informed on trends, such as nutrient planning, water conservation, and energy production from manure.

Insight into Cattle Feeding Industry and Practices
E N D
Presentation Transcript
Beef Cattle Feedyards Brent W. Auvermann Amarillo, TX September 19, 2005
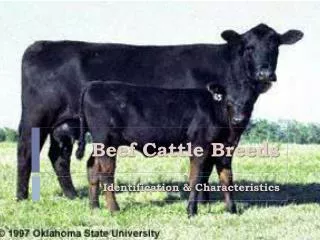
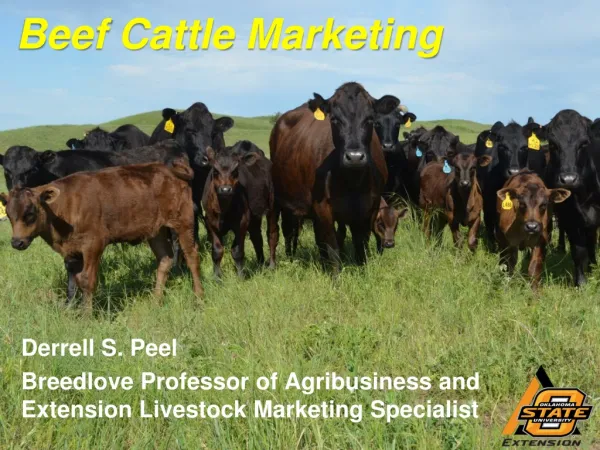
Industry Description • Major cattle-feeding states: TX, KS, NE, IA, OK, CO, ID, WA, AZ, CA • ~ 25 million hd/yr produced on feed • 30% produced within ~150 mi of Amarillo, TX • Increasingly dominated by multi-feedyard corporations (5-10 feedyards, 350-600,000 hd) • Deaf Smith Co. (TX) > 1,000,000 hd • Alberta is Canada’s #1 cattle-feeding province
Feedyard Description • Average one-time capacity increasing & varies geographically (~40,000 in southern High Plains) • One-time capacity x 2.2 = annual throughput • 365/2.2 = 165 days per feeding period, or “turn” – depends on beginning liveweight • Feed-to-gain ratio = 6 (approx.) • Beginning liveweight 350-750 lb. • Market weight 1,100-1,300 lb.
Feedyard Description • Average daily gain (ADG) ~ 3-4 lb/hd/d • Daily intake averages 20-25 lb/d dry matter (DM) • Average water use varies seasonally; 8-15 gal/hd/d • Feed digestibility >80% • Each animal may receive up to 3 or 4 different rations through feeding period • Starter (high roughage) • Step-up or transitional • Finishing (high energy; may exceed 90% digestibility) • Manure production ~ 0.75-1 dry ton/hd (cap)/yr • Corn, sorghum, distillers’ grains, potatoes, other
General Layout • Stocking density = 1/cattle spacing • Typical cattle spacing 150-200 ft2/hd • Total corral area ~3.5-4.5 ac/1,000 hd capacity • 45,000-hd yard covers 200 ac including ancillary areas (feed mill, manure handling, holding ponds etc. • Typical SCS Runoff Curve Number 90-95
Manure and Wastewater Handling • Predominant form: solid manure • Corral scraping >1/yr • May be composted (low N), stockpiled, mounded or directly land-applied (higher N) • N:P2O5 ratio around 1-1.5 • Cereal crops require N:P2O5 ratio of 2.5-3.5 • Over-apply P or under-apply N
Manure and Wastewater Handling • Liquids • Usually little to no process-generated wastewater • Rainfall runoff – full containment (25-yr/24-h) • CN ~ 90-95 • Management objective: rapid drainage • Improves manure quality, reduces odor/dust potential • May be enhanced by mounding • Old vs. new construction practices • Overflow waterers (winter only)
Runoff Holding Ponds • Designed to meet EPA no-discharge standard • “No hydrologic connection” to ground water typically ensured by clay (in situ or imported) or geotextile liner • Clay liners >18” with Ksat<10-7 cm/sec • Management objective: EMPTY • Irrigation-based systems • Evaporative systems
Threats to Water Quality • Surface water • Excess nutrients from land application • Solid manure is P-rich • Historical NMPs (where used) based on N req. • Tailwater from wastewater irrigation • Holding pond overflows • Soil erosion, rainfall runoff
Threats to Water Quality • Ground water • Excess nutrients from land application • Inorganic N is highly soluble; organic P also • Shallow water tables (e. g., S. Platte River, CO) • Unprotected wellheads, old well casings • Poor liner construction or installation • Sweeten et al. (early 1990s) found little to no WQ impact from feedyard holding ponds in Texas Panhandle
National Trends • Steady growth and expansion, but not many new feedyards • Net flow of P from mines in FL to Corn Belt to cattle-feeding states (B. Stewart, WTAMU) • Declining water tables in High Plains will reduce irrigated acreage, crop yield and sustainable fertilization rates • Above-average growth in semi-arid West • Accelerated P-based nutrient planning
Other Trends • Koelsch et al. (2002) found that the ratio of nutrient inputs to “managed outputs” (meat, crops, marketed manure) frequently exceeds 1.0 and may approach 6-10 in extreme cases • Confirms Smolen et al. (late 1990s) finding of significant nutrient concentration in OK cattle-feeding counties • Dead animal disposal a growing concern • Rendering a vanishing prospect for many remote producers • Burial’s time is short • Incineration is energy intensive • “Out of sight, out of mind” • Biosecurity • Water and air quality
Other Trends • Energy production from manure and manure products is returning • $60/bbl crude • Shifts WQ burden incrementally to power plants (ash; dry and wet deposition of stack emissions) • Airborne NH3 dissolves readily in downwind surface water; emissions to be regulated eventually due to secondary PM2.5 production, CERCLA/EPCRA implementation • Secondary PM2.5 formation is a sink for acidic (SOx, NOx) and alkaline (NH3) gases • Fugitive dust showing up as a source of soil nutrient enrichment downwind of cattle feedyards