VisDB: Database Exploration Using Multidimensional Visualization
Scientific and geographic databases contain extensive data, posing challenges in mining useful information due to volume. VisDB system offers flexible query specification, good feedback, and interactivity for exploring large databases efficiently. It focuses on visualizing results, refining queries, and providing approximate data matches. The system calculates relevance factors based on distance measures and sorts data points by relevance for a visual representation. Users can map dimensions, group data, and interactively explore data with query modifications using the VisDB interface. VisDB is effective in identifying clusters, correlations, and anomalies in databases, featuring a robust query specification system.

VisDB: Database Exploration Using Multidimensional Visualization
E N D
Presentation Transcript
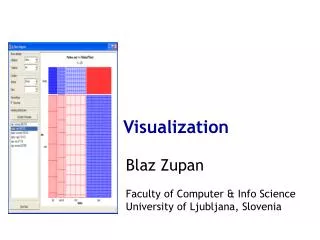
VisDB: Database Exploration Using Multidimensional Visualization Maithili Narasimha 4/24/2001
VisDB Scientific and Geographic databases tend to have large amounts of data. • Some of the challenges in dealing with these databases are: • Mining these databases for useful information is a difficult task due to the sheer volume of data
VisDB • Users do not know what they are looking for exactly. • With traditional query specification languages, it is not possible to specify vague queries and thus not possible to get approximate results. • There is no feedback. Result set may contain too few or too many points.
VisDB Requirements for a good Visualization System to explore large databases: • Flexible Query Specification • Good Query Feedback • Interactive system
VisDB • Also, the users should be able to view as many data points as possible to see the patterns and clusters. • Display size and resolution are limiting factors • Also necessary to display the interdependencies between data attributes, Hotspots(anomalies).
VisDB • The goal of the VisDB system is to address the tasks of visualization of the results , and that of incrementally refining the query to provide an effective way to find interesting data properties.
VisDB • The approach. • Use each pixel of the screen to visualize the results. • Provide data items not only fulfilling the result exactly , but also those that match approximately.
VisDB • Approximate results are determined by a relevance factor. • The relevance factor of a data item is obtained by calculating distances for each selection predicate and combining them. • The more the combined distance, the less the relevance of the data point.
Calculating the Relevance Factor • Calculate the distance. • Simple for Quantitative data. • Nominal and Ordinal? • Combining distances. • User and Query dependent. • Weighting Factor for each attribute. • Normalizing. • Arithmetic Mean for AND and Geometric mean for OR for combining different condition parts. • Relevance Factor is the inverse of the Combined distance.
VisDB • Basic Visualization Technique • Sort the data points according to their relevance, with respect to the query. • Assign colors depending on the relevance. • Plot the sorted, colored points starting from the center of the screen moving outwards in a rectangular spiral fashion.
VisDB • To relate the visualization of the overall result to the visualization of different selection predicates, separate windows for each selected predicate of the query are created and shown along with the result window. • The position of the data items in all the other windows is determined by their position in the overall result window.
VisDB • Mapping two dimensions to the axes • It is possible for the user to assign two attributes to the axes and the system will arrange the relevance factors according to the directions of the distance of the data point from the selection predicate. • With this method it is possible to provide better feedback to the user. • However, we may not be able to use the display efficiently in some cases (I.e. some quadrants may not be used fully, while others are saturated)
VisDB • Grouping the dimensions • The pixels corresponding to the different dimensions of one data item are placed in one area instead of distributing them in different windows. • Will require more pixels per dimension per data item. • May provide more useful visualizations for data sets with larger dimensionality.
VisDB • Interactive data exploration • Users initially specify their queries, using some query language. • Inside the VisDB interactive query and visualization interface, it is possible to view the visualizations and perform query modifications. • System provides sliders for modifying selection predicates, weight factors and other options.
VisDB Conclusion • Useful for identifying and isolating clusters, correlations and hotspots in large databases. • Good Query specification system. • No Zoom or pan for the visualizations.