Download
1 / 18
180 likes | 280 Views
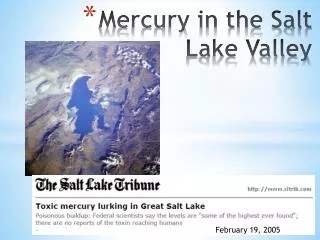
Assessing Winter Storm-Related Non-Recurring Congestion in the Salt Lake Valley. Ralph Patterson 1 , Randy Graham 2 , Kevin Barjenbruch 2 , Glen Merrill 2 , Glenn Blackwelder 1 , Brett Hansen 3 , Mike Holts 3 , Julie Miller 1 , Mike Seaman 2 , Jeff Williams 3 , Audra Yocom 1 , Carol Werner 4

E N D
Assessing Winter Storm-Related Non-Recurring Congestion in the Salt Lake Valley Ralph Patterson1, Randy Graham2, Kevin Barjenbruch2, Glen Merrill2,Glenn Blackwelder1, Brett Hansen3, Mike Holts3, Julie Miller1, Mike Seaman2, Jeff Williams3, Audra Yocom1, Carol Werner4 1Utah Dept of Transportation, Traffic Operation Center, Salt Lake City 2National Weather Service, Salt Lake City 3NorthWest Weathernet, Salt Lake City 4University of Utah, Salt Lake City AMS WAF/NWP Meeting – Omaha, NE
Outline • Partners • Weather Impacts on Roads in the Salt Lake City metro • Comparison of travel impacts associated with two winter weather events • Future work Photo courtesy UDOT AMS WAF/NWP Meeting – Omaha, NE
Unique Collaboration • Federal (NWS), state (UDOT), and private meteorologists (Northwest WeatherNet), academia (University of Utah) • Meteorologists embedded at the UDOT Traffic Operations Center (TOC) • Meteorologists with UDOT and Northwest WeatherNet • Direct involvement of UDOT Traffic Engineer AMS WAF/NWP Meeting – Omaha, NE
Increased Demands…Increased Commute Times • Rapid population growth • 23.5% increase between 2000 and 2008 • Increased demand on existing infrastructure • Congestion results in annual cost of $250 million in Utah (UDOT) • Recurring (i.e., AM/PM peak commute times) • Non-recurring congestion (weather, accidents) • Inclement weather plays a significant role in non-recurring congestion • Delays, mobility, productivity, and safety • “Large weather events cause trips to take 40-50% longer” (UDOT report) Photo courtesy UDOT AMS WAF/NWP Meeting – Omaha, NE
So… Which event will produce the biggest impact? A. 1-3” between 200 PM - 600 PM B. 4-6” between 1000 PM - 400 AM C. 6-8” between Noon - 1000 PM AMS WAF/NWP Meeting – Omaha, NE
Factors in Event Impact • Time of day • Day of week • Snowfall rates • Snowfall amounts • Road temperatures • Mitigation strategies • Holidays • Public perception/preparedness AMS WAF/NWP Meeting – Omaha, NE
Weather Impact on Commute “This is a striking finding – but it seemed intuitive on further consideration. The only things that affect the entire road system around Salt Lake City are snowstorms, or major holidays. Other sources of delay (crashes, thunderstorms, congestion) tend to be more localized.” (UDOT) Travel Time Index (TTI) – Measure of the increase in travel time associated with congestion, incidents and weather. • Example commute of 20 minutes • TTI of 1 = 20 minutes • TTI of 1.3 = 20 x 1.3 = 26 minutes High TTI (congestion and delays) dominated by weather Image courtesy Glenn Blackwelder AMS WAF/NWP Meeting – Omaha, NE
Data…Data…Data… • ~20 events from the winter 2008-09’ • Collection of weather and traffic data • Radar and satellite data • Mesonet observations • Road temperatures • Traffic information • Plow driver reports • Accident information • Investigation of NWS and UDOT statements • Discussion of societal impacts • Does lead time impact volume? AMS WAF/NWP Meeting – Omaha, NE
Tracking Impact • Performance Management System (PeMS) • 240 sensors in the SLC Metro • High temporal (5 min) and spatial resolution (1/2 mile) • Vehicle Miles Traveled (VMT) • Vehicle Hours Traveled (VHT) • Flow • Speed • Delays • Accident Information • Plow Driver Reports AMS WAF/NWP Meeting – Omaha, NE
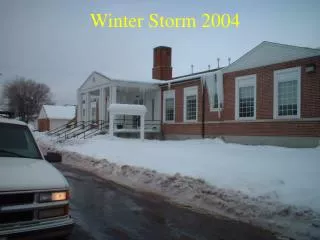
5 Jan 2009 – Well forecast….but • 1-3” forecast for Salt Lake Valley prior to onset • Verified well • Winter Weather Advisory issued near onset • Based on potential impacts on the afternoon commute • Minimal discussion of impact in days leading up to event • Several significant storms had preceded this event Photo courtesy KSL-TV
Road Considerations and Impacts • Road temperatures in the low to mid 20s F • Snow stuck to roads at onset • ??Limited mitigation prior to event?? • Over 180 accidents in Salt Lake and Utah Counties alone • Worst commute of the season 5 Jan 2009 - Road temperatures ~ 420 PM MST AMS WAF/NWP Meeting – Omaha, NE
19 December 2009 • More ‘ramp-up’ to the event • Watch issued 36 hours before onset • Winter Storm Warning issued ~21 hours before onset • Area Forecast Discussion – 442 PM 17 Dec 2008 - …With very cold temps expect snow to rapidly accumulate on area roadways… • Winter Storm Warning – 302 PM 18 Dec 2008 …Snow expected to rapidly accumulate along area roadways and result in treacherous driving conditions… ..Much of this snow may be occurring during the late afternoon and early hours which would have a very significant impact on the evening commute… Add image
Road Considerations and Impacts • Roads temperatures remained near 30 degrees through the event • More effective mitigation • Level of service remained higher throughout the event • Aggressive mitigation prior to and during event • 3-7” storm total 19 Dec 2008 - Road temperatures ~ 400 PM MST AMS WAF/NWP Meeting – Omaha, NE
January 5th Event Speed trough on the 5th was lower Bigger event Reduced flow due to congestion…reduced capacity of system due to slow travel? December 19th Event Increase in flow (above normal) prior to snowfall onset Well forecast onset? Dip right at peak traditional max flow time due to increase in snowfall intensity A lot of similarities between the two events… Drop in discretionary travel Travel is not displaced in time (i.e., flow doesn’t recover) Speeds and flow drop off rapidly right after onset Speed and Flow
Level of Service (LOS) Freeway level of service is defined by the density of vehicles on the road (vehicles per mile per lane), and is a measure of a driver's freedom to maneuver • LOS A - Free flow - the ability to maneuver is unimpeded • LOS B - Reasonably free flow - slight restriction in maneuverability • LOS C - Ability to pass or change lanes is not always assured, but posted speed is maintained, more driver vigilance required • LOS D - Slight reduction in speeds, ability to pass or change lanes reduced, traffic stream has little space to avoid disruption, driver comfort reduced • LOS E - Ability to pass or change lanes is constrained, flow is unstable, speed varies, road is at capacity, drivers are uncomfortable • LOS F - A breakdown in vehicular flow - each vehicle follows another at minimum safe spacing due to demand exceeding capacity. AMS WAF/NWP Meeting – Omaha, NE
So, how was the commute? January 5th event: • Note the significant difference between Mon and Tue • As flow goes down there is high density of vehicles on the roadway • No space, very difficult to switch lanes, vehicles move in lock step, frequent stops • December 19th event: • Higher level of service indicates that people are moving (albeit at a reduced speed, in this case) • Not completely packed on the roads there is spacing • Difference between Thu and Fri is not that significant • Friday afternoon is typically a heavier commute than Monday afternoon • Flow and speed showed similar trends, but driver perception of 19 December commute likely very different than 5 January commute • Better prepared? More effective mitigation? AMS WAF/NWP Meeting – Omaha, NE
Meteorology Road Conditions Public Response Uncertainty and Impact “This is also an encouraging finding because it suggests that the highest overall delay may be predictable (but perhaps not avoidable) with accurate weather forecasts.” – UDOT 2007 Congestion Report It is important to note that one of the most cost effective solutions for mitigation of the congestion problem is driver habit modification. – UDOT Impact AMS WAF/NWP Meeting – Omaha, NE
Future Work • Human Behavior • With confidence in forecast and road impact, can we influence response? • Effective communication strategies? • Increased penalty for false alarms? • Project with NWS/UDOT/NWN and University of Utah - Winter of 09-10’ • Two to three events • ~400 professionally administered driver surveys • Levels of awareness • Sources of information • Responses to road/weather info (behavior modification) • Detailed correlation of weather to travel impacts • Weather Enterprise impact statements AMS WAF/NWP Meeting – Omaha, NE