Download
1 / 18
180 likes | 297 Views
A Four-Dimensional Radar Analysis Tool For AWIPS: The “FSI”. Gregory J. Stumpf 1,2 M. Thomas Filiaggi 2 V. Lakshmanan 1,3 William F. Roberts 4 Michael J. Istok 5 Stephan B. Smith 2. 1 CIMMS / University of Oklahoma 2 NWS Meteorological Development Laboratory

E N D
A Four-Dimensional Radar Analysis Tool For AWIPS:The “FSI” • Gregory J. Stumpf 1,2 • M. Thomas Filiaggi 2 V. Lakshmanan 1,3 William F. Roberts 4 Michael J. Istok 5 • Stephan B. Smith 2 1 CIMMS / University of Oklahoma 2 NWS Meteorological Development Laboratory 3 National Severe Storms Laboratory 4 Forecast Systems Laboratory 5 NWS Systems Engineering Center
Four-Dimensional Stormcell Investigator (FSI) • To increase warning skill and lead time, and therefore improve public service • 3D/4D visualization should allow forecasters to discover new clues and signatures useful in diagnosis of severe and tornadic storms • The FSI project is a multi-agency collaboration • NWS: MDL, SEC • OAR: NSSL, FSL • CIMMS / University of Oklahoma
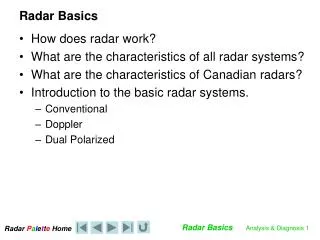
Why three (and four) dimensions? • Because the atmosphere is four-dimensional! • Storm researchers have used 3D/4D displays for years to facilitate their understanding of signatures related to severe weather. • How can operational forecasters utilize 3D/4D visualization in an effective, and rapid manner?
The Lemon Technique (1977) • Original storm structure analysis methods presented using vertical cross-sections (RHIs) • RHIs are not possible with WSR-88D
AWIPS 3D storm interrogation shortcomings • AWIPS users must infer vertical storm structure using 2D representations of radar data. • All Tilts: a series of 2D “horizontal” cross-sections • But PPIs are not horizontal – elevation angles are slanted. • Vertical Cross-sections • Not very easy to use • Only complete during short period at end of volume scan • Not dynamic (must re-draw to get new cross-section) • Warning decision making demands quick and rapid assessment of the 3D structure of storms.
Potential solution:Display Three-Dimensions (D3D) • D3D was designed to display gridded data (e.g., numerical model output) in three-dimensions • Was based on Viz5D technology • Viz5D could not display radar data in its native spherical coordinate system. • Radar data had to be re-mapped to Cartesian space • Lose important information in radial velocity fields
Potential solution:Four-Dimensional Stormcell Investigator (FSI) • Integrate National Severe Storms Laboratory (NSSL) Warning Decision Support System – Integrated Information (WDSSII) 3D/4D display technology into AWIPS • Uses Open GL hardware acceleration on standard video graphics cards (think: video gaming) • The WDSSII technology is already mature enough and would require little additional resources to be easily incorporated into AWIPS. • FSI will be an extension to D2D
FSI Prototype Requirements • Provide for quick and easy access to the data (15-30 seconds per storm) • Provide linkages between 2D representations and 3D data • Still difficult for users to overcome tendency to view in traditional 2D manner • Radar data must be “native” 8-bit resolution polar grids • Z, V, SRM, SW • 4D: Animation while slicing and dicing • GUI should have similar look and feel to D2D • Keyboard shortcuts • Processes must cause minimal impact to AWIPS system resources
FSI Prototype design • WDSSII GUI (wg) • Earth-centric coordinates (earth center is origin) • Open GL hardware acceleration • Radar data represented by 2D textures • Elevation PPI data on conical surfaces • Vertical and horizontal Xsections on 2D planes • 2D textures represented in 3D space • Zoom, pan, pitch, and yaw • “Fly” around and through 3D data
Earth-Relative Coordinates • Data are plotted using earth center as domain origin • All data plotted at lat/lon/ht-MSL • Continuous pan and zoom
Earth-Relative Coordinates • PPI data shows as 2D textures on conical surfaces • Can “fly through” data
Vertical Cross-Sections • Click, draw, and drag concept similar to legacy WDSS and WATADS • Vertical 2D texture is drawn with PPI textures • Can fly around both textures in 3D space • Vertical data accurately represented in 3D space • 1:1 aspect ratio • 1 beamwidth also represented in the vertical • Virtual Volume: Cross sections always have full volume of data.
The Lemon Technique Dynamic Cross-Sections • Can update X-Section line, either by • Dragging entire line • Resetting endpoints • 2D and 3D pictures are linked • Other representations update on-the-fly
PPI: Plan Position Indicator VDX: Vertical Dynamic X-Section CAPPI: Constant Altitude PPI 3D Flier: Three-Dimensional Flier FSI Configuration • Initial prototype will have a fixed 4-panel design:
Implementation in AWIPS • wgNotify: • Persistent server process to update a Radar Linear Buffer for the FSI client • wgLaunch: • Click storm cell on D2D or SCAN Table to launch FSI Display • Will provide a Control Linear Buffer: • Location (lat/lon) • Time • Radar source • Map Info
Warning Decision Training • Through various real-time tests of D3D and WDSSII, it has become generally known that some forecasters weren’t “ready” for 3D analysis. Why? • Very few forecasters have been exposed to 3D analysis in the classroom. • Therefore, concurrent with design, test, and deployment of 3D radar tool must be a ramping up of 3D analysis training at WDTB. • Knobology is important, but the understanding of storm signatures in 3D representations is key.
Operational Implementation • Alpha Version = AWIPS OB7 (Spring ’06) ???? • Future versions: Isosurfaces, storm-relative animation • Experimental warning testbed (several WFOs nationwide) • Development and implementation of application will be concurrent with development of WDTB training
Questions? Email: Greg.Stumpf@noaa.gov NWS Meteorological Development Laboratory Decision Assistance Branch http://www.nws.noaa.gov/mdl/dab/decisionassistbr.htm