Bond Graphs I
190 likes | 224 Views
Learn how bond graphs depict energy flow in physical systems, including power conversion and conservation principles. Explore examples of a-causal and causal bond graphs, with emphasis on energy and power relationships.

Bond Graphs I
E N D
Presentation Transcript
Until this point in the class, we have concerned ourselves with the symbolic manipulation of sets of differential and algebraic equations (DAE’s). We have not yet considered the question, where the equations come from that describe the physics of the systems to be analyzed. For this reason, we had to limit our discussion to the analysis of very simple systems, such as linear electrical circuits, for which we already know from other classes, what equations are needed to describe their dynamics. We shall now touch on the question of modeling systems in the sense of deriving “correct” mathematical descriptions of the dynamics of systems whose underlying equations are hitherto unknown to us. Bond Graphs I
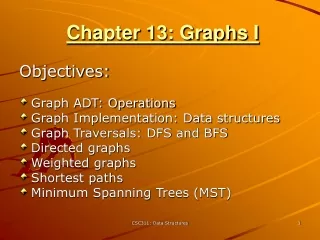
Energy and power Energy flow A-causal bond graphs Example Causal bond graphs Table of Contents
All physical systems have in common their conservation laws for energy and mass. Bond graphs concern themselves intimately with the conservation of energy in a physical system. Since energy in a closed system is being conserved, it can only be affected by any one of three mechanisms : Energy and Power Energy can be stored. Energy can be transported from one place to another. Energy can be converted from one form to another.
The amount of energy (E) present at any one place can only change, if either additional energy is flowing in, or if energy is flowing off. In both cases, we therefore require energy flows that can be defined as the derivatives of energy with respect to time. P is also referred to as Power. The energy is measured in Joule [J], whereas the power is measured in Watt [W]. P = dE/dt Energy and Power II
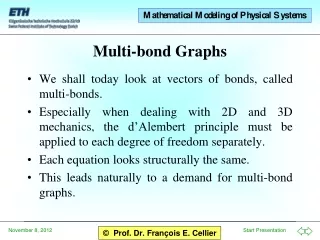
In all physical systems, energy flows can be written as products of two different physical variables, one of which is extensive (i.e., proportional to the amount), whereas the other is intensive (i.e., independent of the amount). In the case of coupled energy flows, it may be necessary to describe a single energy flow as the sum of products of such adjugate variables. Examples: [W] = [V] · [A] Pel = u · i Pmech = f · v = [N] · [m/s] = [kg · m2 · s-3] Energy and Power III
The modeling of physical systems by means of bond graphs operates on a graphical description of energy flows. The energy flows are represented as directed harpoons. The two adjugate variables, which are responsible for the energy flow, are annotated above (intensive: potential variable, “e”) and below (extensive: flow variable, “f”) the harpoon. The hook of the harpoon always points to the left, and the term “above” refers to the side with the hook. e: Effort f: Flow e P = e · f f Energy Flow
i Se + i 0 0 Energy is being added to the system I Voltage and current have opposite directions 0 v v v u u U v U b a a b I 0 I 0 Sf U 0 A-causal Bond Graphs
R i R C I Voltage and current have same directions i i i C i u v v u v v v u u u v u b b a b a a Energy is being taken out off to the system L i Passive Electrical Elements in Bond Graph Representation
e2 e2 e1 = e2 e2 = e3 f1 – f2– f3 = 0 f2 f2 e1 e1 0 1 e3 e3 f1 f1 f3 f3 f1= f2 f2 = f3 e1 – e2– e3= 0 Junctions
iL v2 v1 i1 i2 i0 iC v1 An Example I v2 v0 iL iL uL v0 iL i1 v1 u1 u2 i2 v2 v2 v1 v0 i1 i1 i2 i2 v2 iC v1 i0 iC U0 uC i0 v0 iC i0 v0
P = v0 · i0 = 0 An Example II iL v0 iL uL v1 u2 i2 iL u1 i1 v1 v2 v2 v0 i1 i1 i2 i2 v2 iC v1 i0 iC U0 uC i0 v0 iC v0 i0 v0 = 0
An Example III uL iL u1 i1 v1 v2 u2 i2 i1 i1 uC iC i0 U0
Every bond defines two separate variables, the effort e and the flow f. Consequently, we need two equations to compute values for these two variables. It turns out that it is always possible to compute one of the two variables at each side of the bond. A vertical bar symbolizes the side where the flow is being computed. e f Causal Bond Graphs
The flow has to be computed on the right side. Se i 0 The source computes the effort. U u I 0 Sf The source computes the flow. The causality of the sources is fixed. “Causalization” of the Sources U0 = f(t) I0 = f(t)
I R C R u = R · i i = u/ R i i i i The causality of resistors is free. u u u u du/dt = i / C di/dt = u / I The causality of the storage elements is determined by the desire to use integrators instead of differentiators. “Causalization” of the Passive Elements
e2 e2 e2 = e1 e3 = e1 f1 = f2+ f3 f2 f2 e1 e1 1 0 e3 e3 f1 f1 f3 f3 f2= f1 f3 = f1 e1 = e2+ e3 “Causalization” of the Junctions Junctions of type 0 have only one flow equation, and therefore, they must have exactly one causality bar. Junctions of type 1 have only one effort equation, and therefore, they must have exactly (n-1) causality bars.
U0 .e = f(t) U0 .f = L1 .f + R1 .f dL1 .f /dt = U0 .e / L1 R1 .e = U0 .e –C1 .e U0.e R1.e R1 .f = R1 .e / R1 C1 .f = R1 .f –R2 .f C1.e C1.e U0.e dC1 .e /dt = C1 .f / C1 R2 .f = C1 .e / R2 C1.f R1.f R1.f R1.f L1.f U0.f R2.f C1.e U0.e An Example IV
Cellier, F.E. (1991), Continuous System Modeling, Springer-Verlag, New York, Chapter 7. Cellier, F.E. (1992), “Hierarchical non-linear bond graphs: A unified methodology for modeling complex physical systems,” Simulation, 58(4), pp. 230-248. Cellier, F.E., H. Elmqvist, and M. Otter (1995), “Modeling from physical principles,” The Control Handbook (W.S. Levine, ed.), CRC Press, Boca Raton, FL, pp. 99-108. References I
Cellier, F.E. (1997), “World Wide Web - The Global Library: A Compendium of Knowledge About Bond Graph Research,” Proc. ICBGM'97, 3rd SCS Intl. Conf. on Bond Graph Modeling and Simulation, Phoenix, AZ, pp.187-191. References II