Download
1 / 18
180 likes | 295 Views
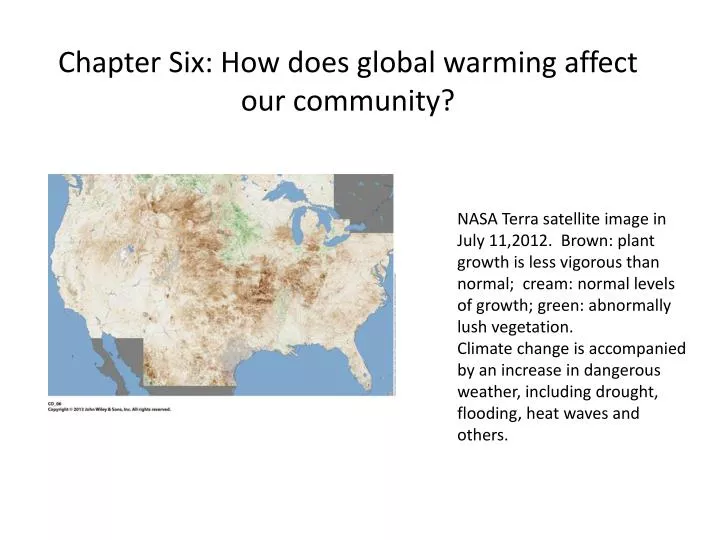
Chapter Six: How does global warming affect our community?. NASA Terra satellite image in July 11,2012. Brown: plant growth is less vigorous than normal; cream: n ormal levels of growth; green: abnormally lush vegetation.

E N D
Chapter Six: How does global warming affect our community? NASA Terra satellite image in July 11,2012. Brown: plant growth is less vigorous than normal; cream: normal levels of growth; green: abnormally lush vegetation. Climate change is accompanied by an increase in dangerous weather, including drought, flooding, heat waves and others.
The effect of global warming can be identified in every sector of the U.S. economy and every region of the continent (at regional level): • Human society and health (shoreline erosion; heat waves • Ecosystems (increased disease and infestation • water resources (S and SW of US experiences severer drought, lead to an increase in wildfires, decreased drinking water, and growing heat stress; The new England, Midwest and southern Canadian regions have seen a sharp increase in flooding and more violent rainstorms). • energy and transportation infrastructure • agricultural
Global temperature anomalies in March 2012 (from march of 1951-1980): East of Rocky Mountains, 25 states had their warmest March on records; 15 more states were in their top 10 warmest; More than 15,000 temperature records were broken.
U.S. temperature trend: According EPA, mean temperature has risen across the lower 48 states since 1901, with an increased rate of warming over the past 30 years. Eight of the top 10 warmest years on record for the lower 48 states have occurred since 1990, and the last 10 five-year periods have each sequentially between the warmest five-year periods on records. U.S. average temperature has risen more than 1.1C (2F) over the past 50 years. North, West and Alaska have increased most. Medical experts are worried that the number of extremely hot days is likely to increase in the future. The elderly, persons with medical disabilities, children, and others with limiting physical conditions are very vulnerable on extremely hot days, especially when power-generating facilities cease working (block out)
Compared to the period 1961-1979, most areas of the United States have warmed 0.5C to 1.C (1F to 2F), resulting in longer warm seasons and shorter, less intense cold seasons. By the middle and end of the century, the average U.S. temperature is projected to increase by 4C to 6C (7 to 11F) under the high-emissions scenario and by approximately 2C to 3.6C under lower-emissions scenario.
Precipitation Trends Over the past 50 years the annual precipitation in U.S. has increased about 5%, although there have been important regional differences. Northeast, Great Plains and Midwest, precipitation has increased. Southeast, decreased occurred in winter, spring and summer (not fall), affecting the growing season and survivability of economically important crops. Northwest, decrease occurred in summer, fall, and winter (not spring). Southwest, precipitation decreased during the summer and fall; but increase in winter and spring
Future Projection for Precipitation • Southern areas, particularly in the west, could become drier and that the northern areas could become wetter • The amount of rain falling in the heaviest downpour has increases approximately 20% on average in the past century and this trend is very likely to continue, with largest increases in the wettest places • Droughts due to changes in precipitation and temperature could increase, with very substantial and almost universally experienced increases in drought risk by 2050. • Southwest and Rocky Mountain states likely to experience the largest increases in drought frequency. • Increase the longevity of droughts in many regions, causing droughts that would otherwise be mild to become severe or even extreme • Earlier melt of seasonal snow pack in the western regions aggravate existing problems with already limited water supplies in the region
Climate Impacts to Planning Sectors • water resources More precipitation comes in the form of heavier rains and snow storms; more precipitation falls as rain rather than snow-peak discharge in spring season arrive earlier-less water for summer and fall Storm tracks northward, dry areas experiencing a decrease in storminess and wet areas experiencing an increase in storminess. See Box 6.1 in page 186. States are preparing for the impacts on water resources: New York, Pennsylvania, California, Oregon, Alaska, and Washington (reducing carbon emission and planning for climate change effects) Others are not acting and remain unprepared: Texas, Alabama, Ohio, Indiana, Kansas, Montana, North Dakota, and South Dakota etc.
2. transportation • Employment in the national transportation and material movement industry accounts for approximately 7.4% of all employment and more than $1 out of every $10 produced in the U.S. Gross domestic product. Five categories of climate change are of particular concern: very hot days and heat waves; Arctic temperatures increase; rising sea levels, intense precipitation events, and hurricane intensity The growth of communities has been tied to the transportation advantage of ports and harbors; but vulnerable to high waves and winds, storms, and tsunamis. Sea Level: • Today’s 100-year floods could instead occur every decade or two because of the sea level rises. • Marine and ground water inundation on major roadways, railroads, airports, seaports, and pipelines on Gulf coast (two thirds of all U.S. Oil imports are transported through the region-home to U.S. oil and gas industry, with offshore drilling platforms, refineries, and pipelines.
Rainfall intensity: • Flooding in Mississippi and Missouri river, paralyzing rail, truck, and marine traffic and a fourth of all U.S. Fright. • Rain in winter and spring instead of snow causes Landslides, mudflows, stream floods and rock falls, can prompt road closure, repair, reconstruction of rail lines and roadways. • Increase weather-related accidents, traffic and rail delays, and disruptions in a network already challenged by increasing congestion. Extreme Heat: • Extreme heat, especially when 32.2C (90F) and above for sustained periods, asphalt softens and develop ruts from heavy traffic, affecting safe operation of cars and trucks; railroad tracks can warp and deform, leading to speed restrictions and derailment in the worst cases. • Vehicles overheat, tires can deteriorate • Health and safety for highway workers, construction crews, and vehicle operators.
Drought: • Wildfires directly threaten the roads and other infrastructure and cause road and rail closures. • Deforested areas by wildfire increase susceptibility to mudslides. • River transportation is seriously affected by drought with reductions in the routes available, shipping season and cargo-carrying capacity Storminess: • High probability of infrastructure failures, such as decking on birdges, washed away roads and rail lines, debris left on roads and rail lines, emergency evacuations, damage to signs and lightning fixtures and reduction in the useful life of highways and rail lines exposed to flooding • Freighters have to be diverted around storms, and sailing schedules are delayed Work on offshore drilling platforms, coastal pumping facilities, sewage-treatment plants, and other marine-dependent activities comes to a halt and costly evacuations are needed. • Harbor infrastructure, such as cranes, docks, and other terminal facilities, damaged during server storms costs billions of dollars to replace
Ecosystems: An ecosystem is an interdependent system of plants, animals, and microorganisms A healthy planet made up of healthy ecosystems If one component is negatively affected by global warming, the entire ecosystem is less robust and less resistant to stress. Without the support of the other organisms within their own ecosystem, life forms would not survive, much les thrive. • 20%-30% of species assessed may be at risk for extinction from climate change impacts in this century if global mean temperatures exceed 2C to 3C (3.6F to 5.4F) relative to preindustrial levels. • Large-scale shifts have occurred in the ranges of species and the timing of the seasons and animal migration • Fires, insect pests, disease pathogens, and invasive weed species have increased • Deserts and semiarid lands are likely to become hotter and drier, feeding a self-reinforcing cycle of invasive plants, fire, and erosion • Coastal and near-shore ecosystems are already under multiple stresses. Climate change an ocean acidification will exacerbate these stresses • Arctic sea ice ecosystems are already being adversely affected by the loss of summer sea ice, and rapidly rising temperatures and further changes are expected. • The habitats of some mountain species and coldwater fish, such as salmon and trout, are very likely to contract in response to warming • Some of the benefits that ecosystems provide to society will be threatened by climate change and others will be enhanced
Ecosystems are very sensitive to changing temperatures, shifts in precipitation, variations n seasonal timing, and other processes. These shifts in established patterns have a strong influence on the processes that control growth and development in ecosystems. Higher temperatures speed up plant growth, rates of decomposition and nutrition cycle. Extreme temperatures, lack of water, soil desiccation, the spread of hardy weeds and others also influence these rates • Spring arrived an average of 10days to two weeks earlier than it did 20 years ago and the growing season is lengthening over much of N. America. • Migratory birds species are returning earlier (13 days earlier in northeast) • The range boundaries of species shifted northwards (6km per decade) as well as upward in elevation • Forest growth has risen • The timing of life-cycle events such as blooming, migration, and insect emergence has changed unevenly, could disrupt interactions between species, such as feeding and pollination Marine Ecosystems: Oceanic plankton and various species of marine fish are shifting northward into cooler water Coral bleaching due to high water temperature
Agricultural It is a key element in the development of human civilization. One third of world workers are still employed in agriculture today (account for only 5% of GDP). The major production include food (cereals, vegetables, fruits, and meat), fibers (cotton, wool, hemp, silk, and flax), fuels (biofuels, methane, ethanol, and biodiesel), and raw materials (lumber, bamboo, and plant resins). Crops: Interact with three factors: temperature, precipitation and CO2. a. Higher temperature (lower level of warming) and CO2: high yields for plants that are below their optimum temperature. But for cereal crops, faster growth means there is less time for the grain itself to grow and mature, and instead the stalk grow faster, lead to lower yield. Many weeds, insects, and pathogens also respond positively to increased T and CO2 b. Higher level of warming, decreased soil moisture, competition with invasive weeds increases costs, and the combined effect of these competing factors leads to diminished yield. (corn, wheat, sorghum, bean, rice, cotton, peanut crops in U.S). c. Excessive rainfall delays spring planting, which jeopardizes profits related to early season production of high-value crops such as melon, sweet corn, and tomatoes. d. Flooding causes fields to become unusable during the growing season (low O2 level in soil, increased susceptibility to root disease, increased soil compaction due to the use of heavy equipment in wet soils. Also causes soil erosion, increased runoff and leaching of agricultural chemicals into surface water and groundwater. e. Weeds, insects pests, and various types of crop and animal diseases benefit from warming and would expand northwards.
Farm animals: • High humidity and temperature stressed animals. Milk production declines in dairy operations; it takes longer for cows in meat operations to reach their target weight, the conception rate in cattle falls and swine growth rate decline due to heat. • Lack of cool night that allows animals stressed by heat to recover (reported individual state losses of 5000 head of cattle in a single heat wave) • Warmer winter temperatures, early arrival of spring, and summer heat also increase the presence of parasites and disease pathogens. • The cost of new housing facilities, treatments, food types, medicines, and other animal care logistics necessary to cope with these new stresses is passed on to the consumer
Society: Human population growth and vulnerability to climate impact are inextricably linked. In Oct 2011, the world population reached 7 billion; in just over 10 years, another one billion people have been added to the human race; the population has far from stabilizing. 2-3 billion people born now to 2050 will live in the cities and towns of low-income countries in Africa and Asia. 13% world population lives in at-risk coastal areas and 75% of those people are located in Asia. Loss of species, rivers run dry, air pollution, sprawling development has degraded ecosystems. • Stressed on energy and food supplies. One billion people are now suffering from food shortage and water scarcity. Then umber will triple within 40 years • Conflict: evidence of a link between civil unrest and higher temperature. 21% of 234 conflict during the period 1950-2004 were probably set off as a result of the high temperatures associated with El Nino events. Much of the civil conflict that arises globally is also sparked by resource scarcity and access issues. (population and temperature) • In U.S 80% of population resides in urban areas. Social problems in Urban: neighborhood degradation, traffic congestion, crime, unemployment, poverty, poor air and drinking water quality, and inequities in health and well-being. Urban heat island: the air temperature inside the city is 3-7F higher than surrounding rural area. (more at night than at day time) 4. Coastal cities are risk of sea level rises and increased hurricane intensity (New York, new Orleans, Miami) Policy change can reduce vulnerability
Energy Supply and Use (the heart of global warming challenge): 78% of U.S. greenhouse gases emission is from energy production and use. • Demanding for cooling energy increases from 5-20% per 1C of warming, the demand for heating energy drops by 3-15% per 1C warming. Renewable energy could potentially used to generate electricity: hydropower, solar and wind power, geothermal energy, and traditional carbon based power sources. • Water shortage will limit the generation of electricity in thermal power plant • Transmission systems of electric utilities could experience a higher rate of failure due to more extreme weather events such as windstorms, ice storms, floods, tornadoes, and hail; power plant operation can be affected by heat waves (intake warmer water to cool power plants compromises operation; higher demand causes block out). • Increases in cloudiness reduces solar energy production; wind energy production would be reduced if wind speeds increase above or fall below the acceptable operating range of the technology; changes in growing conditions could affect biomass production. • Population is shifting to the south and the southwest, where air conditioning use is high. (Counties in South Florida, Atlanta, Los Angeles, Phoenix, Las Vegas, Denver, Dallas, and Houston) % of population change between 1970-2008
Human health: Heat stress, extreme weather events and flooding, water borne diseases, poor air quality, and diseases transmitted by insects and rodents. • Increase in pollen production and prolonged pollen season in a number of plants • Heat waves is a threat to increasing population of senior citizens, people with diabetes and heart disease. It is projected by the 2090s, annual heat-related deaths in Los Angeles would increase by two to three times under a lower emissions scenario and by 5 to 7 times under a higher emissions scenario. • Warmer air temperature increases the production of Ozone (decreases in lung function and damages the lining the lungs) • Increased incidence of waterborne diseases due to pathogens (due to increase in water vapor) • Water contamination related to heavy downpours (sewage overflows, water contamination) • Diseases transmitted by food, water, and insects • Food poisoning due to Salmonella and other bacteria peak within one to six weeks of the highest-reported ambient temperatures • West Nile virus, equine encephalitis, Lyme disease and Hantavirus caused by changes in life cycle and distribution of mosquitoes, ticks, and rodents • Vibriospecis ( shell fish poisoning ) accounts for 20% of the illnesses and 95% of the deaths associated with eating infected shellfish, The U.S. infection rate increased 41% from 1996-2006. • Heavy rain and flooding contaminate food crops with feces from nearby livestock and wild animals, increasing the likelihood of foodborne diseases associated with fresh produce. The distribution of deaths for 11 hazard categories as percentage of the total 19,958 deaths due to these hazard from 1970-2004.