4.1: Do Now
230 likes | 354 Views
4.1: Do Now. John placed a container outside during a rainstorm. A gauge on the side of the container shows the height, in millimeters, of the water in the container. The table below lists the height of water the gauge showed along with the corresponding number of

4.1: Do Now
E N D
Presentation Transcript
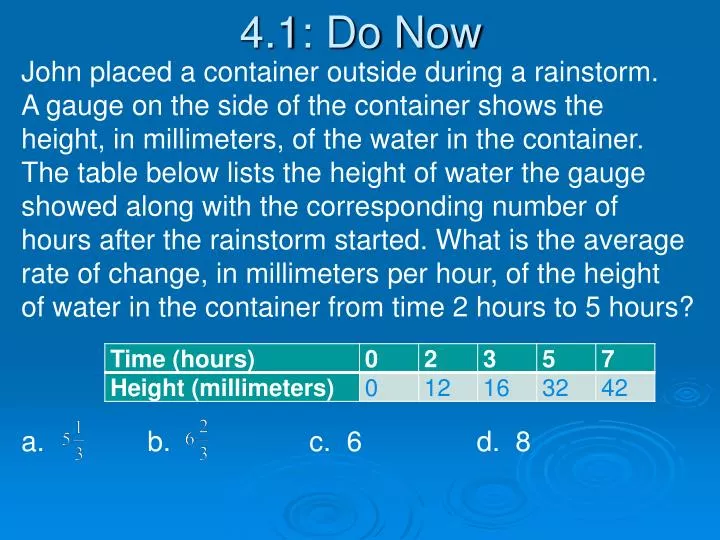
4.1: Do Now John placed a container outside during a rainstorm. A gauge on the side of the container shows the height, in millimeters, of the water in the container. The table below lists the height of water the gauge showed along with the corresponding number of hours after the rainstorm started. What is the average rate of change, in millimeters per hour, of the height of water in the container from time 2 hours to 5 hours? a. b. c. 6 d. 8
Algebra II 4.1: Graphing Quadratic Equations, HW: 4.1: p.240-242 (8, 12, 14, 22, 36, 38, 44-46 all, 58) Quiz 4.1-4.2: TBD
4.1: Notes • Quadratic Equation: • Standard Form: y = ax2 + bx + c • Parabolic shape • Vertical line of symmetry • If a is positive parabola will go up, if a is negative parabola will go down.
Notes • Quadratic Equation: • Through the line of symmetry is the vertex which is either the maximum or minimum value for the parabola. • Vertex is maximum if parabola opens down. • Vertex is minimum if parabola opens up.
Notes continued • Quadratic Equation continued. y = ax2 + bx + c • Equation for line of symmetry: • x-coordinate of vertex (find y-value by plugging in x-value and solving:
Tell whether the function has a minimum value or maximum value. Then find the minimum or maximum value. 1.) y = -6x2 – 1 2.) f(x) = 2x2 + 8x + 7
Steps to graphing a quadratic equation • Steps: y = ax2 + bx + c 1.) Find the vertex. 2.) Graph using a table of values with the vertex in the middle.
Do Now The figure shows the graph of the profit function for a company. In the graph, y represents the profit, in thousands of dollars, that the company earns for selling x thousand items. Interpret the meaning of the two intercepts shown in the context of the problem.
Algebra II 4.2: Graph quadratic function in vertex or intercept form HW: 4.2: p.249-251 (4, 8, 10, 16, 18, 34, 52, 54)
4.2: Vertex Form • y = a(x – h)2 + k • Vertex: (h, k) • Graph using table
4.2: Intercept form • Steps in graphing intercept form y = a(x – p)(x – q) • Plot the x-intercepts: points p and q • Find x-coordinate of vertex by averaging p and q: • Find y-coordinate of vertex by plugging in x-coordinate and solving. Plot the vertex.
3 types of graphs 1.) Stand. form: y = ax2 + bx + c 1.) x-coordinate of vertex: 2.) chart with vertex in the middle 2.) Vertex form: y = a(x – h)2 + k 1.) vertex: (h, k) 2.) chart with vertex in the middle 3.) Intercept form: y = a(x – p)(x – q) 1.) x-intercepts: p and q 2.) x-coordinate of vertex: average p and q. Find y by plugging in.
1.) y = 3x22.) y = (x – 4)(x – 2)3.) y = -2x2 + 54.) y = ½x25.) y = (x – 2)2 6.) y = 3x2 + 6x – 47.) y = ½(x + 1)(x – 2) 8.) f(x) = -x2 - 2x - 1 Graph and determine the domain and range.


