2009 Commercial GSO Demand Forecast and Analysis of Space Transportation
140 likes | 270 Views
This report presents the 2009 Commercial Geostationary Satellite Orbit (GSO) Demand Forecast, including key insights from the FAA and COMSTAC. It covers a comprehensive market analysis, methodology, and forecast sensitivities, demonstrating a slight decrease in satellite and launch demand from previous years. The working group includes experts from Boeing, SpaceX, and other leading companies. This study is essential for understanding market trends and planning for satellite launches from 2009 to 2018, providing valuable data to stakeholders in the space transportation sector.

2009 Commercial GSO Demand Forecast and Analysis of Space Transportation
E N D
Presentation Transcript
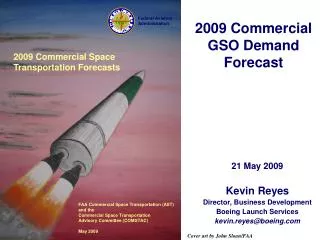
Federal Aviation Administration 2009 Commercial GSO Demand Forecast 2009 Commercial Space Transportation Forecasts 21 May 2009 Kevin Reyes Director, Business Development Boeing Launch Services kevin.reyes@boeing.com FAA Commercial Space Transportation (AST) and the Commercial Space Transportation Advisory Committee (COMSTAC) May 2009 Cover art by John Sloan/FAA
GSO FORECAST AGENDA • Forecast Summary • Working Group • Market Description • Methodology • Forecast Sensitivities • Demand Forecast • Launch Forecast • 2008-2009 Totals Comparison • Operator Assessments • Trends • Summary
2009 GSO Demand Summary 2009-2018 commercial GSO satellite and launch demand forecast decreased by 1 from 2008 Average 20.8 Average 15.7
Working Group Members Gwynne Shotwell SpaceX (2008 & 2009 GSO Forecast Chair) Kevin Reyes Boeing (2009 GSO Forecast Deputy Chair) John Sloan FAA AST Lisa Hague Aerospace Corp. Jozsef Lore Boeing Veronica Johnson United Launch Alliance Alan Keisner SpaceX David Keslow Orbital Chris Kunstadter XL Insurance Tom Monroe SS/L Jennifer Micelli Tecolote Research / USAF / SMC / MV Peter Stier Sea Launch Jeanne Beesley Boeing Beth King Lockheed Martin Deborah Facktor Lepore Air Launch
GSO Methodology • Information requested of ~ 90 launch providers, satellite manufacturers & operators • 21 companies responded in 2009 (29 in 2008) • Individual & comprehensive responses • Int’l competitive procurements only • Sort satellites by mass categories • Small - < 2,500 kg • Medium - 2,500 to 4,200 kg • Large - 4,200 to 5,400 kg • Extra Large - > 5,400 kg • Assign satellite demand to launchers
GSO MethodologyCont. • Questionnaire on factors affecting their satellite procurement plans • 13 satellite operators responded in 2009 (17 in 2008) • 6 operators responded in both 2008 & 2009 • 7 new responders in 2009 • Near term manifest (2009-2011) • Long term forecast (2012-2018)
Realization factor developed for sensitivities Maximum and Minimum Variations of actual launches vs. forecasted demand Calculated over 5-year rolling period GSO Forecast Sensitivities • Several factors identified that impact launch forecast • Satellite-Related issues • Launch Vehicle-Related issues • Schedule-Related issues • Dual-Manifesting • Weather • Plan performance • Funding • Regulatory
GSO Trends • Long-Term Satellite Forecast • Relatively stable in the near term • Satellites – flat to slight decrease • Launch demand – slight decrease • Satellite mass – slight increase • Transponders per satellite – slight increase • Relatively consistent average in the long term • Launch demand – flat (~15 launches/yr) • Satellites – flat (~20 satellites/yr)
GSO Forecast Summary • 2009 satellite demand of 27 planned for 21 launches • Combination of single and dual manifest • 2010 satellite demand of 21 planned for 16 launches • Combination of single and dual manifest • Projected average annual demand (2009-2018) • 20.8 satellites • 15.7 launches • Other factors identified may affect launchers • New launch vehicle entrants • Dual manifest launches • Operator assessments negative compared to 2008 • Some responder changes from 2008 survey • Uncertain economic conditions • Reliability of launchers/satellites • Hosted payloads • ITAR free satellites