Download
1 / 17
170 likes | 488 Views
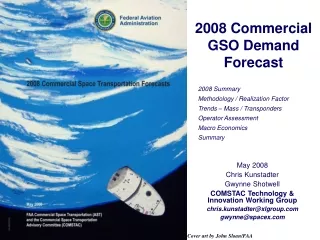
2008 Commercial GSO Demand Forecast. 2008 Summary Methodology / Realization Factor Trends – Mass / Transponders Operator Assessment Macro Economics Summary. May 2008 Chris Kunstadter Gwynne Shotwell COMSTAC Technology & Innovation Working Group chris.kunstadter@xlgroup.com

E N D
2008 Commercial GSO Demand Forecast 2008 Summary Methodology / Realization Factor Trends – Mass / Transponders Operator Assessment Macro Economics Summary May 2008 Chris Kunstadter Gwynne Shotwell COMSTAC Technology & Innovation Working Group chris.kunstadter@xlgroup.com gwynne@spacex.com Cover art by John Sloan/FAA
2008 GSO Summary 2008-2017 commercial GSO satellite and launch demand forecast increased by 1 from 2007 Average 21.8 Average 16.2
Report History • Commercial GSO launch demand forecast • Updated annually since 1993 • Methodology has been consistent over time, with ongoing enhancements to reflect industry evolution • Update this year - smallest mass class was < 2,200 kg, now < 2,500 kg • 10-year forecast horizon (2008-2017) • 2008 report updates • Realization factor • Growth in satellite mass and transponders per satellite • Industry developments that may affect demand • Respondents’ views on factors affecting demand
Working Group Participation Gwynne Shotwell SpaceX (2008 GSO Forecast Chair) Beth King Lockheed Martin (2007 GSO Forecast Chair) Dr. Alexander Liang Aerospace Corp. (T&IWG Chair) John Sloan FAA AST Darren Chambo Lockheed Martin Lisa Hague Aerospace Corp. Doug Howe / Josef Lore Boeing Veronica Johnson / Greg Caudel ULA David Keslow Orbital Chris Kunstadter XL Insurance Joanna Malvino / Bill Hayes / Kathy Shockey / Tom Monroe SS/L Jennifer Miceli Tecolote Research / USAF / SMC / MV Chris O’Connell Sea Launch Chris Sanders P&W Rocketdyne
Forecast Data Request • Ten-year GSO satellite launch demand requested from 92 organizations worldwide • 29 inputs received (versus 22 last year) • Comprehensive • 6 US and 3 international satellite manufacturers / launch service providers (same as 2007) • Individual • 20 demand inputs from satellite operators (increased from 13 last year) • Questionnaire on factors affecting market demand • 18 satellite operators responded to questions on how various factors affected their plans to procure new satellites • Up from 12 respondents in 2007
Forecast Methodology • Near-term (2008-2010) mission model • “Bottoms-up” by identified satellite • Timing and likelihood of launches assessed • Long-term (2011-2017) demand forecast • Average of comprehensive domestic forecasts by mass categories • International input used as a cross check • Only “addressable” commercial GSO satellites • Defined as those open for internationally competitive launch service procurement • 2008 addressable launches includes the first Long March launch (Palapa D) defined as addressable since 1997
Satellite and Launch Demand Forecast Large increase in near-term demand from the 2007 forecast
Historical Forecast Comparison 2008 near-term forecast higher than 4 of 5 most recent forecasts
Satellite Launch “Realization” vs. Demand • The GSO forecast projects demand for satellite launches • Several factors can affect the execution of a scheduled launch in a given year • Satellite issues • Launch vehicle issues • Manifesting & scheduling issues • Funding • Weather • Regulatory delays • A “realization factor” is based on an analysis of historical forecast vs. actual satellite launches for the first and second year of the forecast • No change in this methodology from last year • 2007 actuals fell within realization range
2007 Actual Satellites vs. Forecasted Demand • Reason for delay Planned Actual • 23 18 • Launch vehicle (3) • Thor 5, AMC 14 and Thuraya 3 • Satellite / launch vehicle (1) • ICO-GEO 1 • Satellite (1) • Star One C2 78% actual vs. forecast Realization factor predicted 15-19 launches
Forecast With Realization Since implementation of the realization factor, actual number of satellites launched has fallen within adjusted band
Forecast By Satellite Mass Class Forecast indicates stability in satellites to be launched in two highest mass classes Smallest satellite class increases in the near term, then decreases and stabilizes
Total and Average Satellite Mass Launched Average satellite mass stabilizing at ~4,200 kg after peak of 4,500 kg in 2005
Spacecraft Trends: Transponders Slight drop in average transponders launched per year An increase is expected in 2009
Satellite Operator Assessment • Only two areas are more negative than in last year’s survey • Ability to compete with terrestrial services • Ability to get required licensing • Remaining are more positive than last year • Economic conditions had less negative impact (watch item for next year) • Demand for services • Availability of financing • Availability of affordable insurance (watch item for next year) • Availability / reliability of launch vehicles • Consolidation of service providers • Increasing satellite lifetimes • Availability of satellite systems to meet requirements • Reliability of satellite systems • Availability & reliability of launchers • Ability to obtain required export licensing
Summary of Findings • 2008 GSO demand forecast • 2008-2017 average annual satellite demand of 21.8 per year (increase by 1 from 2007 forecast) • 2008-2017 average annual launch demand of 16.2 per year (increase by 1 from 2007 forecast) • 2008 satellite demand of 27, with a realization between 17 and 22 • More positive outlook from respondents than in 2007 • Ability to compete with terrestrial services and licensing are the only areas more negative than last year • Growth in demand in coming years could be helped by • DARS & MSS growth • Hosted payloads • New commercial launch competitors • Economic conditions and recent launch failures may impact results in 2008-2009