Download
1 / 50
510 likes | 739 Views
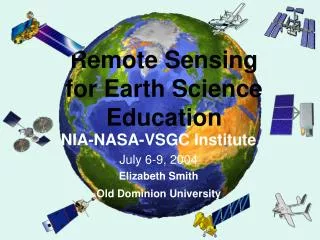
Remote Sensing for Earth Science Education. University of Maryland Compton Tucker & Megan Weiner. NIA-NASA-VSGC Institute July 6-9, 2004 Elizabeth Smith Old Dominion University. Remote Sensing for Earth Science Education. What is remote sensing? How is remote sensing useful?

E N D
Remote Sensing for Earth Science Education University of Maryland Compton Tucker & Megan Weiner NIA-NASA-VSGC Institute July 6-9, 2004 Elizabeth Smith Old Dominion University
Remote Sensing for Earth Science Education • What is remote sensing? • How is remote sensing useful? • How is remote sensing done? • What do scientists study using remote sensing? • What can we teach using remote sensing? • Virginia SOL Correlations • Fundamentals of Remote Sensing
What is Remote Sensing? Remote sensing is the science (and to some extent, art) of acquiring information about the Earth's surface without actually being in contact with it. This is done by sensing and recording reflected or emitted energy and processing, analyzing, and applying that information. http://fermi.jhuapl.edu/states/avhrr/about_avhrr.html
How is Remote Sensing Useful • It enables us to observe and studynature in ways that would otherwise be beyond human capability, across great distances and at wavelengths of light invisible to human eyes. Spaceborne Imaging Radar C/X-band Synthetic Aperture (SIR-C/X-SAR) image from October 5, 1994 http://southport.jpl.nasa.gov/
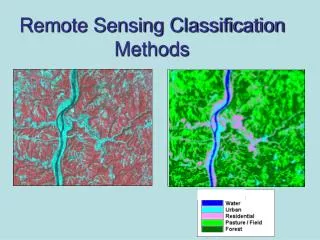
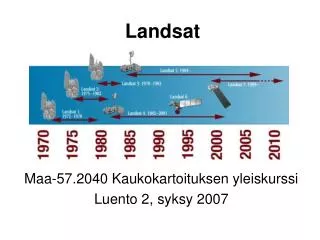
Landsat How is Remote Sensing Done? Special detectors are used to record light as it’s emitted or reflected by the objects of interest. By manipulating and studying the images we can answer questions about Earth. http://earthobservatory.nasa.gov/Newsroom/NewImages/images.php3?img_id=3329
What Do Scientists StudyUsing Remote Sensing? Land, air, water, rocks, living things, ice and snow • Climate change and its effects • Productivity of grasslands • How human activities change land cover • Landforms we can’t see from the ground • Photosynthesis on land and in the ocean • Air quality: chemicals and particles (aerosols) • The extent of natural hazards such as volcanoes, floods, and drought • Shifting ecosystem boundaries: deserts, forests, and wetlands • Ocean currents, temperature, winds • Air-sea interactions • Sea ice
Agriculture The atmosphere, including weather and climate Biology The carbon cycle Chemistry Earth system science Ecology Geography Geology Global environmental change Hydrology Land use, landforms, and mapping Natural hazards (volcanoes) Oceanography (physical, biological, and geological) What Can We TeachUsing Remote Sensing?
Virginia SOL Correlations Standard ES.1 a, b - Skills: • Interpret data from a graph or table that shows change in mass, density, or temperature over time. • Interpret data from a graph or table that shows changes in temperature or pressure with depth.
Virginia SOL Correlations Standard ES.1 c, d, e The student will plan and conduct investigations in which c) scales, diagrams, maps, charts, graphs, tables, and profiles are constructed and interpreted; d) variables are manipulated with repeated trials; and e) a scientific viewpoint is constructed and defended (the nature of science).
Virginia SOL Correlations Standard ES.1 c, d, e – Skills • Compare topographic maps of different scales. • Construct a graph, table, chart, and/or diagram from data. • Interpret graphs and diagrams. • Use scientific methodology to design and test a hypothesis.
Virginia SOL Correlations Standard ES.2 a, b, c, d, e - Skills Demonstrate scientific reasoning and logic • Make predictions, using scientific data and data analysis. • Use data to support or reject a hypothesis. • Explain how the scientific method is used to validate scientific theories.
Virginia SOL Correlations Standard ES.3 a, b, c, d The student will investigate and understand how to read and interpret maps, globes, models, charts, and imagery. Key concepts include: a) maps (bathymetric, geologic, topographic, and weather) and star charts; b) imagery (aerial photography and satellite images); c) direction and measurements of distance on any map or globe; and d) location by latitude and longitude and topographic profiles.
Virginia SOL Correlations Standard ES.4 a, b The student will investigate and understand the characteristics of the Earth and the solar system. Key concepts include a) position of the earth in the solar system; and b) sun-Earth-moon relationships (seasons, tides, and eclipses).
Virginia SOL Correlations Standard ES.11 Oceanography Standard ES.12 Atmospheric Science Standard ES.13 Energy Transfer and Weather
Remote Sensing Fundamentals • Electromagnetic (EM) Radiation and the EM Spectrum • Interactions with the Atmosphere and with a Target (i.e., leaves, ocean, land) • Passive vs. Active Remote Sensing • Characteristics of Images (i.e., resolution) • Satellite Orbits • Examples (atmospheric, terrestrial and oceanographic)
Fundamentals of Remote Sensing In much of remote sensing, the process involves an interaction between incident radiation and the targets of interest. This is exemplified by the use of imaging systems where the following seven elements are involved: • Energy Source or Illumination • Radiation and the Atmosphere • Interaction with the Target • Recording of Energy by the Sensor • Transmission, Reception and Processing • Interpretation and Analysis • Application http://www.ccrs.nrcan.gc.ca/ccrs/learn/tutorials/fundam/fundam_e.html
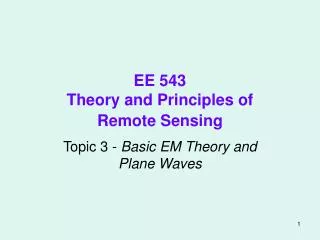
Electromagnetic Radiation Remember, the first requirement for remote sensing is to have an energy source to illuminate the target (unless the sensed energy is being emitted by the target). This energy is in the form of electromagnetic radiation. All electromagnetic radiation has fundamental properties and behaves in predictable ways according to the basics of wave theory. Electromagnetic radiation consists of an electrical field (E) which varies in magnitude in a direction perpendicular to the direction in which the radiation is traveling, and a magnetic field (M) oriented at right angles to the electrical field. Both these fields travel at the speed of light (c).
Characteristics of Electromagnetic Radiation Two characteristics of electromagnetic radiation are particularly important for understanding remote sensing. These are the wavelength and frequency: Wavelength (λ) is the length of one wave cycle, which can be measured as the distance between successive wave crests (meters) Frequency (ν) refers to the number of cycles of a wave passing a fixed point per unit of time (hertz (Hz) = cycles per second). Wavelength and frequency are related by the following formula: C = λνwhere λ = wavelength (m) ν = frequency (cycles per second, hz) c = speed of light (3x10⁸ m/s)
The Electromagnetic Spectrum The electromagnetic spectrum ranges from the shorter wavelengths (including gamma and x-rays) to the longer wavelengths (including microwaves and broadcast radio waves).
The Electromagnetic Spectrum Ultraviolet radiation (UV): The shortest wavelengths which are practical for remote sensing. This radiation is just beyond the violet portion of the visible wavelengths, hence its name. Some Earth surface materials, primarily rocks and minerals, fluoresce or emit visible light when illuminated by UV radiation.
The Electromagnetic Spectrum Visible radiation: The light which our eyes - our own "remote sensors" - can detect is part of the visible spectrum. The visible portion of the EM spectrum is quite small relative to the rest of the spectrum. • Violet: 0.4 - 0.446 μm • Blue: 0.446 - 0.500 μm • Green: 0.500 - 0.578 μm • Yellow: 0.578 - 0.592 μm • Orange: 0.592 - 0.620 μm • Red: 0.620 - 0.7 μm Visible waves have great utility for remote sensing of vegetation and for the identification of different objects by their visible colors.
The Electromagnetic Spectrum Infrared Radiation (IR): The infrared (IR) region covers the wavelength range from approximately 0.7 mm to 100 mm - more than 100 times as wide as the visible portion! The infrared region can be divided into two categories based on their radiation properties - the reflected IR, and the emitted or thermal IR. Scientists use the near-IR to determine the health of vegetation and to monitor forest fires.
The Electromagnetic Spectrum Microwave Radiation These are the longest wavelengths used for remote sensing. The shorter wavelengths have properties similar to the thermal infrared region while the longer wavelengths approach the wavelengths used for radio broadcasts.
Electromagnetic Radiation Every material on earth reflects uniquely in each wavelength when it is exposed to electromagnetic radiation (visible light and “invisible light”, such as infrared or ultraviolet rays). Also, when the material gets hot, it radiates at a unique strength in each wavelength. This figure shows the strength of reflection and radiation from plants, earth and water in each wavelength. The horizontal axis shows wavelength, left side is shorter and right side is longer.
Interactions With the Atmosphere Absorption causes molecules in the atmosphere to absorb energy at various wavelengths. Ozone, carbon dioxide, and water vapor are the three main atmospheric constituents which absorb radiation. Because these gases absorb EM energy in very specific regions of the spectrum, they influence where in the spectrum we can "look" for remote sensing purposes. Those areas of the spectrum which are not severely influenced by atmospheric absorption and thus are useful to remote sensors are called atmospheric windows (in red).
Interactions with the Atmosphere • Before radiation used for remote sensing reaches the Earth's surface it has to travel through some distance of the Earth's atmosphere. Particles and gases in the atmosphere can affect the incoming light and radiation. These effects are caused by the mechanisms of scattering and absorption. Rayleigh scattering occurs when particles are very small compared to the wavelength of the radiation. Why is the sky blue? Mie scattering occurs when the particles are just about the same size as the wavelength of the radiation. Nonselective scattering occurs when the particles are much larger than the wavelength of the radiation.
Radiation - Target Interactions • Radiation that is not absorbed or scattered in the atmosphere can reach and interact with the Earth's surface. There are three (3) forms of interaction that can take place when energy strikes, or is incident (I) upon the surface. These are: absorption (A); transmission (T); and reflection (R).
Leaves: An Example of a Target at the Earth's Surface A chemical compound in leaves called chlorophyll strongly absorbs radiation in the red and blue wavelengths of visible light, but reflects green wavelengths. Hence, leaves appear "greenest" in the summer, when chlorophyll content is at its maximum. In autumn, there is less chlorophyll in the leaves, so there is less absorption and proportionately more reflection of the red wavelengths, making the leaves appear red or yellow (yellow is a combination of red and green wavelengths).
Water: An Example of a Target at the Earth's Surface Longer wavelength visible and near infrared radiation is absorbed more by water than shorter visible wavelengths. Thus water typically looks blue or blue-green due to stronger reflectance at these shorter wavelengths, and darker if viewed at red or near infrared wavelengths. If there is suspended sediment present in the upper layers of the water body, then this will allow better reflectivity and a brighter appearance of the water. Chlorophyll in algae absorbs more of the blue wavelengths and reflects the green, making the water appear more green when algae is present.
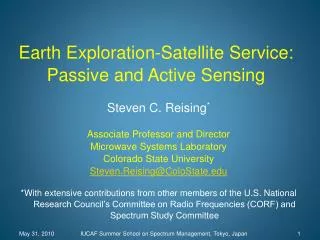
Passive vs. Active Sensing • Passive sensors measure energy that is naturally available from the sun (or as re-emitted by the earth). Reflected energy during the daytime only. Thermal IR can be detected at night too. Clouds can be problematic. • Active sensors provide their own energy source for illumination. The sensor emits radiation which is directed toward the target to be investigated. The radiation reflected from that target is detected and measured by the sensor.
Characteristics of Images • Electromagnetic energy may be detected either photographically or electronically. • Image - any pictorial representation, regardless of what wavelengths or remote sensing device has been used to detect and record the electromagnetic energy. • Photograph - refers specifically to images that have been detected as well as recorded on photographic film.
Spatial Resolution The detail discernible in an image is dependent on the spatial resolution of the sensor and refers to the size of the smallest possible feature that can be detected. Images where only large features are visible are said to have coarse or low resolution. In fine or high resolution images, small objects can be detected. Generally speaking, the finer the resolution, the less total ground area can be seen. Spatial resolution of pixels is governed by a satellite characteristic called Instantaneous Field of View.
Temporal Resolution One day average Eight day average
Satellite Orbits http://www.classzone.com/books/earth_science/terc/content/investigations/ esu101/esu101page03.cfm?chapter_no=investigation
Weather Goes visible. Measures sunlight reflected by the clouds and surface of the earth. http://www.ghcc.msfc.nasa.gov/GOES
Clouds Goes infrared. Measures energy emitted from clouds and Earth. Temperature can be derived. http://www.ghcc.msfc.nasa.gov/GOES
Rain Rate This estimate of monthly precipitation is expressed as a rate (average millimeters of accumulated precipitation per day). The estimate is computed from data observed by Microwave Imagers aboard Defense Meteorological Satellite Program platforms, infrared sensors flying on Geo-IR, and rain gauges. This monthly averaged, global data set spans about 25 years, from 1979 through the present (Jan. 2004) http://precip.gsfc.nasa.gov/index.html
Pollution MOPITT is a scanning, nadir viewing eight channel IR radiometer. CO and CH4 concentrations will be measured using correlation spectroscopy. http://www.eos.ucar.edu/mopitt/data/plots/mapsv3_mon.html
Land • Vegetation greenness: Measured by visible and infrared channels of a NOAA instrument called the Advanced Very High Resolution Radiometer (AVHRR) I have provided monthly-averaged NDVI images for 10 years (1991-2001) for North America on the CD as well as some global NDVI which we will use in the exercises.
How Land Changes Over Time January 16th, 1973 March 12th, 1989 January 6th, 2003 Mississippi River Delta as seen by the Landsat 7 Enhanced Thematic Mapper Plus (ETM+) sensor which includes a 15-meter (m) panchromatic band (band 8), as well as improved resolution (60 m) for the thermal infrared band (band 6). http://landsat7.usgs.gov/gallery/change/218/
1992 2001 Land Use Changes Over Time Richmond, Virginia
Land Use Project Learning Tree: http://www.cnr.vt.edu/PLT/
Land Use USGS National Land Cover Data for Virginia Counties http://fisher.lib.virginia.edu/collections/gis/nlcd/browse_county.html Virginia Gazeteer http://fisher.lib.virginia.edu/collections/gis/vagaz/search_by_county.php
Ocean Temperature Thermal IR and visible channels on NOAA’s AVHRR allow scientists to calculate Sea surface temperature, at resolutions as high as 1KM. The image above represents a monthly average for Feb. 02, and the spatial resolution is about 75KM. http://podaac-esip.jpl.nasa.gov/poet// I have provided a 23-year, monthly averaged SST record on the CD.
Ocean Temperature The important feature of microwave retrievals is that SST can be measured through clouds, which are nearly transparent at 10.7 GHz. This is a distinct advantage over the traditional infrared SST observations that require a cloud-free field of view. Ocean areas with persistent cloud coverage can now be viewed on a daily basis. www.ssmi.com (Remote Sensing Systems)
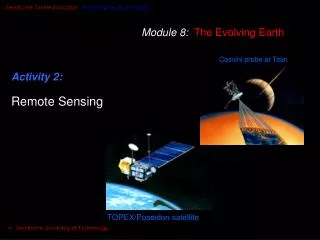
Measuring Ocean TopographyActive Microwave Radar Remote Sensing From its vantage point 1336 kilometers (830 miles) above the Earth, TOPEX/Poseidon can measure the height of the ocean surface directly underneath the satellite with an accuracy of 4-5 centimeters (better than 2 inches). Traveling in excess of 7 kilometers (4 miles) every second as it traces out its orbit, TOPEX/Poseidon covers the global oceans every 10 days (the "repeat period" of the satellite orbit). http://sealevel.jpl.nasa.gov/index.html
Effects of El Niño During an El Niño year, tropical rains usually centered over Indonesia shift eastward, influencing atmospheric wind patterns world wide.
Ocean Color as a measure of primary productivity SeaWiFS data are collected in eight (8) different bands in the visible and near infrared part of the electromagnetic spectrum. For each band, the detector measures the intensity of the light that reaches the sensor. http://seawifs.gsfc.nasa.gov/SEAWIFS/TEACHERS/
Ocean Color on a Local Scale http://www.cbrsp.org/cbrsp_index.htm