Visualizing Partial Derivatives without Graphs.
Visualizing Partial Derivatives without Graphs. . Martin Flashman. Humboldt State University and Occidental College. flashman@humboldt.edu. Abstract. In this presentation the author will explain and use free graphing technology ( Winplot ) to illustrate

Visualizing Partial Derivatives without Graphs.
E N D
Presentation Transcript
Visualizing Partial Derivatives without Graphs. Martin Flashman. Humboldt State University and Occidental College. flashman@humboldt.edu
Abstract • In this presentation the author will • explain and use free graphing technology (Winplot) to illustrate • how to visualize the partial derivative without graphs. • The treatment is suitable for any introductory treatment of the concept. • Based on mapping (transformation) figures this approach • allows students to understand the concepts in an n-dimensional context • without any change in presentation from that given for the ordinary derivative.
FoundationsMapping (Transformation) Figures • Visualize functions f : RR y = f(x) • Winplot examples: • linear • nonlinear
Dynamic interpretation • Dynamic interpretation of the derivative visualized using • y/x • rates • Illustrate using Winplot
Visualizing Multi-Variable Functions • Visualize functions f : RnR y = f(x1,x2,…,xn) • Visualize f : R2R y = f(x1,x2)
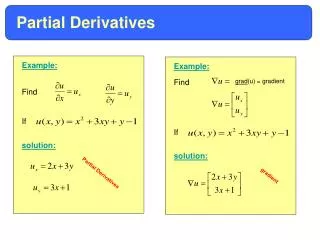
Visualizing The Partial Derivative fory = f(x1,x2) • Dynamic interpretation of the partial derivatives for f : R2R y = f(x1,x2) visualized using y/x1 and y/x2. • Static picture next slide. • Winplot dynamic visualization.
Visualizing The Partial Derivative fory = f(x1,x2,…,xn) • Dynamic interpretation of the partial derivative for f : RnR y = f(x1,x2,…,xn) visualized using y/x1, … , y/xn. • Static picture here. • Winplot dynamic visualization.
Conclusion • Can use this visualization for other aspects of functions • f : RnRk f(x1,x2,…,xn)=(y1,y2,…,yk) where yk = fk(x1,x2,…,xn)
Time! • Questions? • Responses? • Further Communication by e-mail: flashman@humboldt.edu • These notes will be available at http://www.humboldt.edu/~mef2
Thanks- The end!