Download
1 / 19
220 likes | 415 Views
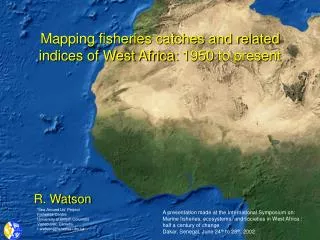
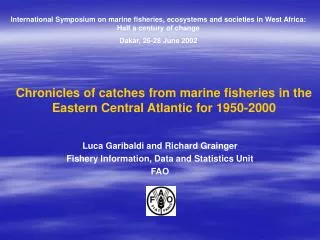
International Symposium on marine fisheries, ecosystems and societies in West Africa: Half a century of change Dakar, 26-28 June 2002. Chronicles of catches from marine fisheries in the Eastern Central Atlantic for 1950-2000. Luca Garibaldi and Richard Grainger

E N D
International Symposium on marine fisheries, ecosystems and societies in West Africa: Half a century of change Dakar, 26-28 June 2002 Chronicles of catches from marine fisheries in the Eastern Central Atlantic for 1950-2000 Luca Garibaldi and Richard Grainger Fishery Information, Data and Statistics Unit FAO
1. Catch statistics collected by FAO-FIDI in the Eastern Central Atlantic-CECAF area The CECAF area and its divisions Code Name 34.1.1 Morocco coastal 34.1.2 Canaries/Madeira insular 34.1.3 Sahara coastal 34.1.9 Northern coastal, not known 34.2.0 Northern oceanic 34.3.1 Cape Verde coastal 34.3.2 Cape Verde insular 34.3.3 Sherbro 34.3.4 Western Gulf of Guinea 34.3.5 Central Gulf of Guinea 34.3.6 Southern Gulf of Guinea 34.4.1 Southwest Gulf of Guinea 34.4.2 Southwest oceanic 34.9.0 Not known (CECAF area) 34.0.0 Tunas (CECAF area) http://www.fao.org/fi/statist/fisoft/FISHPLUS.asp
The revised ISSCAAP groups • 'International Standard Statistical Classification for Aquatic Animals and Plants' (ISSCAAP) defines 50 groups of species. • ISSCAAP groups have been recently revised • a new useful grouping for coastal fishes • better identification of demersal and pelagic species • For the first time, aggregations of data by the new ISSCAAP groups are discussed
2. Overview of the 2000 catches respect to the previous year • Total catches for 2000 in Eastern Central Atlantic about 3,500,000 tonnes, a slight reduction from 1999 • Among the 10 major fishing countries in the area • Netherlands and Morocco increased • Spain and Russian Federation showed significant decreases • Totals by the new ISSCAAP groups reveal: • increase of small pelagic catches (mainly mackerels) • decrease of coastal and demersal fish catches • catches of valuable species such as tunas, crustaceans and cephalopods decreased
3. Characterization of the CECAF divisions by ISSCAAP groups' catches • Catch statistics for the 1970-2000 period of the seven coastal CECAF divisions have been plotted by the ISSCAAP groups • Average percentage accounted for by "Marine fishes not identified" for each coastal division are as follows: Code Division name Percentage 34.1.1 Morocco coastal 7.6% 34.1.3 Sahara coastal 7.5% 34.3.1 Cape Verde coastal 10.1% 34.3.3 Sherbro 7.5% 34.3.4 Western Gulf of Guinea 10.9% 34.3.5 Central Gulf of Guinea 15.2% 34.3.6 Southern Gulf of Guinea 15.6%
Division 1.1 - Morocco coastal Clupeoids and other pelagic fishes dominate catches in the two northern coastal divisions. Significant catches of molluscs, mainly cephalopods. Division 1.3 - Sahara coastal
Division 3.1 - Cape verde coastal Division 3.3 - Sherbro Catch trends in three central divisions are still influenced by the fluctuations of clupeoids but coastal and demersal fishes begin to have a greater importance. Division 3.4 - Western Gulf of Guinea
Division 3.5 - Central Gulf of Guinea In two remaining coastal divisions, all the groups of species are fairly well represented. Maybe this is a sign of more varied and stable marine ecosystems, which have supported a more steady rise of catches throughout the last 30 years, although the distribution and abundance of important fishery resources have varied (Koranteng,1999). Division 3.6 - Southern Gulf of Guinea
4. Historical trends of Distant Water Fleets catches Total catches by DWFs Share of DWFs catches on total catches
DWFs' catches by ISSCAAP group Share of DWFs catches on total catches by ISSCAAP group
DWFs' catches by major CECAF divisions Share of DWFs catches on total catchesof major CECAF divisions
5. Development of fisheries and the state of marine resources • Development of fisheries on the main resources in the Eastern Central Atlantic since 1950 chronicled • Top 38 species items analysed (account for 75% of marine capture production) • Using cluster analysis, time series grouped according to their shapes into five groups
Species of Cluster 1, which dominate the catches, include several pelagic species • Species in Cluster 2, many of them subject of distant water fishing fleets • Cluster 3 includes mostly coastal species with limited catches which showed a rapid decline in the 1970s and have not recovered. • Fisheries for the pelagic species of Cluster 4, which were probably strongly regime-influenced • Species of Cluster 5 dominated by sardinellas and bigeye tuna
Percentage of major marine fish resources in various phases of fishery development • Simple fishery development model assumed comprising four phases • Phase 1: Undeveloped • Phase 2: Developing • Phase 3: Mature • Phase 4: Senescent (declining) • Time series classified to phase according to slope of the line for 3-year average catches
Percentage of major marine fish resources in various phases of fishery development (contd.) • The total number (and percentage) of resources in each phase were calculated each year, across the whole data set.
Conclusions • Analysis demonstrates strikingly the development of fisheries • 90% of the resources were classified as “undeveloped” in 1950s • 68% of them were either “mature” or senescent” in 1990s • Very little room for further expansion of harvest from these fish stocks • Increase in resources which are subject to declines in productivity (“senescent” or Phase IV) • Consistent with analysis by Grainger and Garcia (1996) which indicated the Eastern Central Atlantic was fully fished in 1980s and estimated maximum production region can provide is 4.3 million tonnes.