Download
1 / 52
520 likes | 659 Views
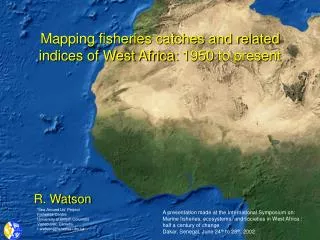
Mapping fisheries catches and related indices of West Africa: 1950 to present. R. Watson. ‘Sea Around Us’ Project Fisheries Centre University of British Columbia Vancouver, Canada r.watson@fisheries.ubc.ca. A presentation made at the International Symposium on:

E N D
Mapping fisheries catches and related indices of West Africa: 1950 to present R. Watson ‘Sea Around Us’ Project Fisheries Centre University of British Columbia Vancouver, Canada r.watson@fisheries.ubc.ca A presentation made at the International Symposium on: Marine fisheries, ecosystems, and societies in West Africa : half a century of change Dakar, Senegal, June 24th to 28th, 2002
FAO FAO FAO Databases Databases Databases
FAO FAO FAO A A A Databases Databases Databases ‘Official’ Records ‘Official’ Records ‘Official’ Records
Exclusive Economic Zones Data from Veridan
FAO FAO FAO A A A Databases Databases Databases ‘Official’ Records ‘Official’ Records ‘Official’ Records Taxonomic Taxonomic Taxonomic B B B Disaggregation Disaggregation Disaggregation
Depth Data from NGDD
Distribution Ranges N Latitude Range S Minimum Depth Maximum Depth
Primary Productivity Data from EC Marine Environment Unit
Coral Reef Coral data from WCMC
Species Distributions Cod Gadus morhua
FAO FAO FAO A A A Databases Databases Databases ‘Official’ Records ‘Official’ Records ‘Official’ Records Taxonomic Taxonomic Taxonomic B B B Disaggregation Disaggregation Disaggregation ‘Disaggregated’ ‘Disaggregated’ ‘Disaggregated’ Records Records Records
FAO FAO FAO A A A Databases Databases Databases ‘Official’ Records ‘Official’ Records ‘Official’ Records Taxonomic Taxonomic Taxonomic B B B Disaggregation Disaggregation Disaggregation ‘Disaggregated’ ‘Disaggregated’ ‘Disaggregated’ Records Records Records Spatial Spatial Spatial C C C Disaggregation Disaggregation Disaggregation
FAO FAO FAO A A A Databases Databases Databases ‘Official’ Records ‘Official’ Records ‘Official’ Records Taxonomic Taxonomic Taxonomic B B B Disaggregation Disaggregation Disaggregation ‘Disaggregated’ ‘Disaggregated’ ‘Disaggregated’ Records Records Records Spatial Spatial Spatial C C C Disaggregation Disaggregation Disaggregation D D D Catch rate by spatial cell Catch rate by spatial cell Catch rate by spatial cell
Taxon (what) Country (who) FAO Area (where)
Taxon (what) Country (who) FAO Area (where) Taxon Distribution Database Fishing Access Database Spatial Reference Database
Taxon (what) Country (who) FAO Area (where) Taxon Distribution Database Fishing Access Database Spatial Reference Database
Taxon (what) Country (who) FAO Area (where) Taxon Distribution Database Fishing Access Database Spatial Reference Database Common Spatial Cells?
Taxon (what) Country (who) FAO Area (where) Taxon Distribution Database Fishing Access Database Spatial Reference Database Common Spatial Cells? NO Refine Rules/Databases
Taxon (what) Country (who) FAO Area (where) Taxon Distribution Database Fishing Access Database Spatial Reference Database Common Spatial Cells? YES Assign Catch Rate to Common Cells
El Niño events El Niño event Uncorrected Global Landings 90 85 80 75 70 65 Landings (million tonnes) 60 55 50 45 0 1970 1975 1980 1985 1990 1995 2000
Corrected Global Landings 90 85 80 75 70 65 Landings (million tonnes) Uncorrected 60 55 50 45 0 1970 1975 1980 1985 1990 1995 2000
Corrected, no anchoveta Global Landings 90 85 80 75 70 65 Landings (million tonnes) Uncorrected Corrected 60 55 50 45 0 1970 1975 1980 1985 1990 1995 2000
90 90 90 Peruvian 80 80 80 Anchovy 70 70 70 Demersal 60 60 60 Landings (million tonnes) 50 50 50 40 40 40 Pelagics 30 30 30 20 20 20 10 10 10 Invertebrates 1950 1950 1950 1955 1955 1955 1960 1960 1960 1965 1965 1965 1970 1970 1970 1975 1975 1975 1980 1980 1980 1985 1985 1985 1990 1990 1990 1995 1995 1995 Global Landings Peruvian Anchovy Demersal Landings (million tonnes) Pelagics
Landings by Exclusive Economic Zone Morocco 1.51* *Max. Catch Million tonnes
Landings by Exclusive Economic Zone Morocco Mauritania 0.77 *Max. Catch Million tonnes
Landings by Exclusive Economic Zone Morocco Mauritania Senegal 0.37 *Max. Catch Million tonnes
Landings by Exclusive Economic Zone Morocco Mauritania Senegal Gambia 0.03 *Max. Catch Million tonnes
Landings by Exclusive Economic Zone Morocco Mauritania Senegal Gambia Guinea Bissau 0.20 *Max. Catch Million tonnes
Landings by Exclusive Economic Zone Morocco Mauritania Senegal Gambia Guinea Bissau Guinea 0.20 *Max. Catch Million tonnes
Landings by Exclusive Economic Zone Morocco Mauritania Senegal Gambia Guinea Bissau Guinea Sierra Leone 0.16 *Max. Catch Million tonnes
Landings by Exclusive Economic Zone Morocco Mauritania Senegal Gambia Guinea Bissau Guinea Sierra Leone Liberia 0.03 *Max. Catch Million tonnes
Landings by Exclusive Economic Zone Morocco Mauritania Senegal Gambia Guinea Bissau Guinea Sierra Leone Liberia Cote d’ Ivoire 0.08 *Max. Catch Million tonnes
Landings by Exclusive Economic Zone Morocco Mauritania Senegal Gambia Guinea Bissau Guinea Sierra Leone Liberia Cote d’ Ivoire 1950 1970 1990 Ghana 0.12 *Max. Catch Million tonnes
Landings by Exclusive Economic Zone Benin Morocco Mauritania Senegal Gambia Guinea Bissau Guinea Sierra Leone Liberia Cote d’ Ivoire 1950 1970 1990 Ghana 0.02 *Max. Catch Million tonnes
Landings by Exclusive Economic Zone Benin Morocco Nigeria Mauritania Senegal Gambia Guinea Bissau Guinea Sierra Leone Liberia Cote d’ Ivoire 1950 1970 1990 Ghana 0.29 *Max. Catch Million tonnes
Landings by Exclusive Economic Zone Benin Morocco Nigeria Mauritania Senegal Cameroon Gambia Guinea Bissau Guinea Sierra Leone Liberia Cote d’ Ivoire 1950 1970 1990 Ghana 0.05 *Max. Catch Million tonnes
Landings by Exclusive Economic Zone Benin Morocco Nigeria Mauritania Senegal Cameroon Gambia Eq Guinea Guinea Bissau Guinea Sierra Leone Liberia Cote d’ Ivoire 1950 1970 1990 Ghana 0.07 *Max. Catch Million tonnes
Landings by Exclusive Economic Zone Benin Morocco Nigeria Mauritania Senegal Cameroon Gambia Eq Guinea Guinea Bissau Gabon Guinea Sierra Leone Liberia Cote D’ Ivoire 1950 1970 1990 Ghana 0.05 *Max. Catch Million tonnes
Landings by Exclusive Economic Zone Benin Morocco Nigeria Mauritania Senegal Cameroon Gambia Eq Guinea Guinea Bissau Gabon Guinea Congo Rep Sierra Leone Liberia Cote D’ Ivoire 1950 1970 1990 Ghana 0.04 *Max. Catch Million tonnes
Landings by Exclusive Economic Zone Benin Morocco Nigeria Mauritania Senegal Cameroon Gambia Eq Guinea Guinea Bissau Gabon Guinea Congo Rep Sierra Leone Congo Dem Rep Liberia Cote D’ Ivoire 1950 1970 1990 Ghana 0.09 *Max. Catch Million tonnes
Landings by Exclusive Economic Zone Benin Morocco Nigeria Mauritania Senegal Cameroon Gambia Eq Guinea Guinea Bissau Gabon Guinea Congo Rep Sierra Leone Congo Dem Rep Angola Liberia Cote D’ Ivoire 1950 1970 1990 Ghana 0.58 *Max. Catch Million tonnes
Landings by Exclusive Economic Zone Benin Morocco Nigeria Mauritania Senegal Cameroon Gambia Eq Guinea Guinea Bissau Gabon Guinea Congo Rep Sierra Leone Congo Dem Rep Angola Liberia Namibia Cote D’ Ivoire 1950 1970 1990 Ghana 1.20 *Max. Catch Million tonnes
Landings by Exclusive Economic Zone Benin Morocco Nigeria Mauritania Senegal Cameroon Gambia Eq Guinea Guinea Bissau Gabon Guinea Congo Rep Sierra Leone Congo Dem Rep Angola Liberia 1950 1970 1990 Namibia Cote D’ Ivoire 1950 1970 1990 Ghana South Africa 1.53 *Max. Catch Million tonnes
Landings by Exclusive Economic Zone Benin Morocco Nigeria Mauritania Senegal Cameroon Gambia Eq Guinea Guinea Bissau Gabon Guinea Congo Rep Sierra Leone Congo Dem Rep Angola Liberia 1950 1970 1990 Namibia Cote D’ Ivoire 1950 1970 1990 Ghana South Africa 1.51* 0.02 0.29 0.77 0.05 0.37 0.07 0.03 0.05 0.20 0.04 0.20 0.16 0.09 0.58 0.03 1.20 0.08 1.53 0.12 *Max. Catch Million tonnes