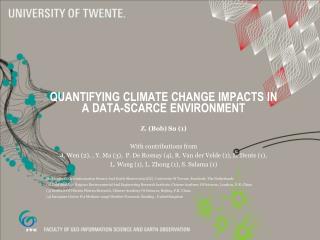
Quantifying Climate Change Impacts in Data-Scarce Environments
500 likes | 598 Views
This study addresses the lack of plateau-scale water cycle measurements in the Third Pole Environment and aims to quantify climate change impacts and identify variations, trends, and extremes in hydroclimatic variables using satellite data, in-situ observations, and models.

Quantifying Climate Change Impacts in Data-Scarce Environments
E N D
Presentation Transcript
Quantifying Climate Change Impacts In Data-scarce Environments Z. (Bob) Su (1) Email: z.su@utwente.nl or b_su@itc.nl www.itc.nl/wrs With contributions from Y. Ma (3), J. Wen (2), P. De Rosnay (4), R. Van der Velde (1), L. Dente (1), L. Wang (1), L. Zhong (1), S. Salama (1), J. Timmermans (1) Faculty Of Geo-information Science And Earth Observation (IIC), University Of Twente, Enschede, The Netherlands Institute Of Tibetan Plateau Research, Chinese Academy Of Sciences, Beijing, P.R. China Cold And Arid Regions Environmental And Engineering Research Institute, Chinese Academy Of Sciences, Lanzhou, P.R. China European Centre For Medium-range Weather Forecasts, Reading , United Kingdom
Content • Background & Objectives • In-situ networks, satellite observations & model outputs • Quantifying hydroclimatic variables • Vegetation • Surface temperature • Soil moisture • Water levels • Climatic impacts - variations, trends, and extremes? • Suggestions and conclusion
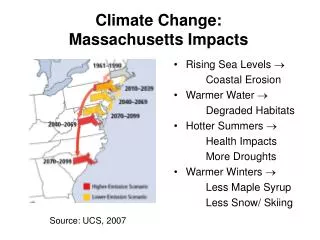
Background: Lack of plateau-scale measurements of water cycle components in the Third Pole Environment • IPCC “… Working Group II contribution to the underlying assessment refers to poorly substantiated estimates of rate of recession and date for the disappearance of Himalayan glaciers.” (IPCC statement on the melting of Himalayan glaciers, 20 Jan. 2010). • There is a critical lack of knowledge for this unique environment, because, current estimates of the plateau water balance rely at best on sparse and scarce observations • Current in-situ observation data cannot provide the required accuracy, spatial density and temporal frequency for quantification of impacts and development of adaptation and mitigation measures.
Objectives • A framework for quantification of climate change impacts and attribution of causes • Quantification of uncertainties in satellite retrievals & model outputs using in-situ observations • Identification of variations, trends, and extremes in plateau scale hydroclimatic variables • Climatic impacts or monsoon pattern changes – actions for stakeholders?
Earth Observation and Water Resources Radiation Precipitation (100%) Water Storage in Ice and Snow Condensation (65%) Vapour Transport (35%) Evaporation/ Transpiration (65%) Water Resources Management Evaporation (100%) Soil Moisture River Discharge (35%) Groundwater Storage & Flow
ITC/CAS Soil Moisture Networks Ngari Maqu Naqu ~ Network July 2008 ESA Dragon programme EU FP7 CEOP-AEGIS project ESA WACMOS project ~ Network June 2006 ~ Network June 2010
Tibetan Soil Moisture Experiments at location of CAMP/Tibet sites (in collaboration with Prof. Yaoming Ma, ITP/CAS) GEWEX Asian Monsoon Experiment (GAME) in the Tibet Plateau (GAME/Tibet,1996-2000) CEOP (Coordinated Enhanced Observing Period) Asia-Australia Monsoon Project in the Tibetan Plateau (CAMP/Tibet, 2001-2005) Coordinators: Y.M.Ma & T.D.Yao, K.Ueno & T.Koike ESA Dragon Programme, EU FP7 CEOP -AEGIS
Part I - Vegetation • Adequacy of satellite observations of vegetation changes in relation to hydroclimatic conditions • (Zhong et al., 2010, Cli. Change; Zhong et al., 2011, J. Cli. In press)
Map of vegetation cover types on the Tibetan Plateau (1 km resolution land cover map from GLC2000)
Average seasonal mean NDVI variations over the Tibetan Plateau Vegetation response to climate variability 1. Vegetation density <-> general climate pattern in the Tibetan Plateau. The Asian monsoon had a great impact on the seasonal variation in NDVI. 2. Correlations between NDVI and climate variables differ for different land uses. 3. Vegetation density increasing in 49.87% of the total area. What are the causes?
Part – II Land surface temperature • Adequacy of satellite observations for quantifying climatic impacts in LST • (Oku and Ishikawa, 2003, JAMC; Salama et al., 2011, IEEE TGRS, in review)
Surface Temperature Interannual Variation Monthly mean surface temperature averaged across the Tibetan Plateau + 0.2 K/yr Surface temperature over the plateau is rising year by year. (Oku & Ishikawa, 2003)
Daily Maximum and Minimum Surface Temperature + 0.13 K/yr + 0.39 K/yr Maximum Minimum Daily minimum surface temperature rises faster than maximum temperature. (Oku & Ishikawa, 2003)
Decadal variations of land surface temperature observed over the Tibetan Plateau SSM/I 1987-2008 (a) measured T2.5cm versus SSM/I TBv37GHz for both calibration (light squares) and validation (dark circles) sets; (b) derived versus measured temperatures using the independent validation set.
A warming plateau or a cooling plateau? Trends of LST anomalies derived from the 1987-2008 SSM/I data set: (a) TPE – Tibetan Plateau and surrounding areas, (b) Tibetan Plateau
Trends of LST anomalies observed over the Tibetan Plateau vs elevation i) the formation of water ponds during the rainy monsoon; ii) the growth of water reservoirs in the TP caused by snow and glacier melting due to temperature increase ? A cross section at 32± N of monthly LST anomalies. (Yanai and Wu [2006] described the Tibetan Plateau as a heat source for the atmosphere in the summer with exception of the south eastern part.)
Part III – Soil moisture • Adequacy of satellite observations for quantifying climatic impacts • (Su et al., 2011, HESS; van der Velde et al., 2011, J.Cli. - in review)
Volumetric soil moisture, ASCAT data, 1-7 July 2007 Soil moisture (m3/m3 ) Volumetric soil moisture, AMSR-E VUA-NASA product, average 1-7 July 2007 (Pixel size 0.25°, White pixels = flag values = sea, ice, forest)
Validation of soil moisture retrievals at Naqu site (Cold & semi-arid), Tibetan plateau (July-Oct. 2008)
40 km 80 km Maqu in-situ soil moisture & soil temperature measurements • calibrated for soil texture and derived the final soil moisture time series
Maqu site - Soil temperature (upper panel) and soil moisture (lower panel) measured at 5 cm soil depth at Maqu network
Time series retrieval (SSM/I) vs in-situ observations SSM/I soil moisture retrievals and measurements from Naqu, North, East and South stations plotted over time.
Trends in mean and anomaly in plateau scale soil moisture (1987-2008, SSM/I retrievals)
Trends in plateau scale soil moisture (SSM/I) The center pixels of the areas selected within central Tibet and SE-Tibet are about 90.5 oE/ 33.0 oN and 103.0 oE/ 25.0 oN (WSG84).
Part IV – model outputs • Ability of the ECMWF model in simulating and analysis of root zone soil moisture on the Tibetan plateau • (Su et al., 2011, JGR – in review)
Figure 2a. Soil moisture from the ECMWF operational run (ECMWF-OI, where the SM analysis uses the Optimal Interpolation method) compared to in-situ measured soil moisture in the Naqu network area.Figure 2b. Soil moisture from the ECMWF-EKF-ASCAT run (using the EKF soil moisture analysis with ASCAT data assimilation) compared to in-situ measured soil moisture (green) at the Naqu network area.
Figure 3a. Soil moisture from the ECMWF operational run (ECMWF-OI, where the SM analysis uses the OI) compared to in-situ measured soil moisture at the Maqu network area.Figure 3b. Soil moisture from the ECMWF-EKF-ASCAT run (using the EKF soil moisture analysis with ASCAT data assimilation) compared to in-situ measured soil moisture at the Maqu network area.
(ECMWF) operational land surface analysis system and the new soil moisture analysis scheme based on a point-wise Extended-Kalman Filter (EKF) for the global land surface • For the cold semiarid Naqu area the ECMWF model overestimates significantly the regional soil moisture in the monsoon seasons, which is attributed to spurious soil texture patterns of soil texture. • For the cold humid Maqu area the ECMWF products have comparable accuracy to in-situ measurements. Comparison between liquid soil moisture content from ECMWF and ground stations measurements and satellite estimates from the ASCAT sensor shows good performances of the ASCAT product as well as the ECMWF soil moisture analysis.
Part IV –Terrestrial Water Storage • An example in the Upper Reach of Yellow River • (in prep. Su et al., 2011)
Space Gravimetry (The Gravity Recovery and Climate Experiment (GRACE). )
Upper Reach of Yellow River basin in northeast Qinghai-Tibetan plateau
Time series of TWS of Upper Reach of Yellow River(Top GRACE obs, bottom GLDAS output)
Monthly Yellow River discharge at Lanzhou hydrological station (Top).Annual discharge at Lanzhou hydrological station from 2003 to 2009 (Bottom)
Cumulative discharge anomalies and TWS (right axis) estimated from GRACE observations and GLDAS state variables(circles - the measured discharge at Lanzhou station, solid line - estimates by GRACE/GLDAS)
Describe • Trends (change) • Variability (natural cycle) • Outliers Understand Attribution (variability vs. error) Consistency Process (e.g. Volcanic eruption, fire/aerosol) Feedback links (e.g. ENSO teleconnection) A Roadmap From Process Understanding To Adaptation Climate Change Adaptation In Water Resources • Detect • • Hot Spot • • Quality issue • • Outside Envelope • Predict • Impacts • Adapt • Consequences
ESA STSE programme: Water Cycle Multimission Observation Strategy (WACMOS) Radiation Water vapour (transport to land 35%, condensation 65%) Clouds (Precipitation, 100%) Water Storage in Ice and Snow Water Resources Management Evaporation (land 65%, ocean 100%) Soil Moisture Discrharge to ocean (35%) Groundwater Storage & Flow
Continental scale simulations 1 Jan – 9 Dec 2009, grid resolution 25 KM
WACMOS.org wacmos.org
An outlook – a niche for action Climate change adaptation may determine most likely the future of the mankind. ITC MSc/PhD programme Water Resource and Environmental Management ITC Water resources and Environmental Management http://www.itc.nl/Pub/Study/Courses/C10-WREM-MSC-01 http://www.itc.nl/wrs/
Recommendations (Proposed action points) • Satellite observations in data scarce environment are critical for quantifying climatic impacts – application agencies should develop dedicated capacities • Uncertainties in satellite observations needed to be quantified with in-situ reference observations data – data sharing is badly needed – a role for stakeholders? • Modeling results need to be verified before used in drawing conclusions about climatic change impacts – NWP centers & science groups • Concerted actions needed to aggregate and analyze climatic impacts in data scare environment • Existing studies need to be analyzed in detail – separating those based observation data with uncertainty certification from less rigorous studies
Referances/Further Readings • Su, Z., W. Wen, L. Dente,, R. van der Velde, 334 , L. Wang, Y. Ma, K. Yang, and Z. Hu (2011), A plateau scale soil moisture and soil temperature observatory for the quantification of uncertainties in coarse resolution satellite products, Hydrol. Earth Sys. Sci. • Su, Z., P. de Rosnay, J. Wen, L. Wang, 2011, Ability of the ECMWF 1 model in simulating and analysis of root zone soil moisture on the Tibetan plateau, J. Geophys. R. (in review) • van Der Velde, R., Z. Su, 2009, Dynamics in land surface conditions on the Tibetan Plateau observed by ASAR, Hydrological sciences journal , Hydrological sciences journal, 54(6), 1079-1093. • van der Velde, R., Z. Su, and Y. Ma, 2008, Impact of soil moisture dynamics on ASAR signatures and its spatial variability observed over the Tibetan plateau. Sensors, 8(2008) 9, pp. 5479-5491. • van der Velde, R., Z. Su, M. Ek, M. Rodell, and Y. Ma, 2009, Influence of thermodynamic soil and vegetation parameterizations on the simulation of soil temperature states and surface fluxes by the Noah LSm over a Tibetan plateau site, Hydrology and Earth System Sciences, 13, 759-777 • van der Velde, R., M. Ofwono, Z. Su, Y. ma, 2010, Long term soil moisture mapping over the Tibetan plateau using Special Sensor Microwave Imager (SSM/I), L. Clim. (in review) • Wen, J. , Z. Su, 2003, Estimation of soil moisture from ESA Wind-scatterometer data, Physics and Chemistry of the Earth, 28(1-3), 53-61. • Wen, J. , Z. Su, 2004, An analytical algorithm for the determination of vegetation Leaf Area Index from TRMM/TMI data, International Journal of Remote Sensing, 25(6), 1223–1234. • Wen, J. , Z. Su, 2003, A Method for Estimating Relative Soil Moisture with ESA Wind Scatterometer Data, Geophysical Research Letters, 30 (7), 1397, doi:10.1029/ 2002GL016557. • Wen, J. , Z. Su, Y. Ma, 2003, Determination of Land Surface Temperature and Soil Moisture from TRMM/TMI Remote Sensing Data, Journal of Geophysical Research, 108(D2), 10.1029/2002JD002176. • Zhong, L., Ma, Y., Salama, M.S., Su, Z., 2010, Assessment of vegetation dynamics and their response to variations in precipitation and temperature in the Tibetan Plateau. Climatic change, DOI 10.1007/s10584-009-9787-8. • Zhong, L, Ma, Y., Su, Z., Salama, M.S., 2010, Estimation of Land Surface Temperature over the Tibetan Plateau using AVHRR and MODIS Data, Adv. Atmos. Sci., doi: 10.1007/s00376-009-9133-0.