Download
1 / 38
380 likes | 551 Views
Tailwinds to Headwinds Democratic Business Caucus April 9, 2013. Board of Directors Sheila T. Francoeur, Chair David Alukonis William H. Dunlap Eric Herr Dianne Mercier Richard Ober James Putnam Stephen J. Reno Stuart V. Smith, Jr. Donna Sytek Brian F. Walsh Mike Whitney

E N D
Tailwinds to Headwinds Democratic Business CaucusApril 9, 2013 Board of Directors Sheila T. Francoeur, Chair David Alukonis William H. Dunlap Eric Herr Dianne Mercier Richard Ober James Putnam Stephen J. Reno Stuart V. Smith, Jr. Donna Sytek Brian F. Walsh Mike Whitney Martin L. Gross, Chair Emeritus Todd I. Selig Kimon S. Zachos Directors Emeritus “…to raise new ideas and improve policy debates through quality information and analysis on issues shaping New Hampshire’s future.”
Summary • NH is a low tax, high income state with about average levels of spending when you control for major drivers of state spending (e.g. poverty). • NH has been the benefactor of significant demographic tailwinds. • What’s next?
Low Spending? Size of State Government (Spending) 5 Source: www.statehealthfacts.org
Additional Spending Measures? NH Spends slightly more than the national average, per person in poverty 7
Tax burdens flat when expressed as a function of our productivity Since the late seventies, state and local tax burdens have declined slightly (through 2009) 9
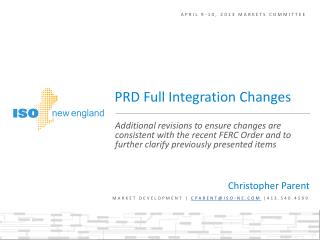
Forecasting Revenue Growth Going Forwards The coming negotiations over the 2014-2015 state budget will be dictated, in large part, by forecasts for tax revenue growth in the next two years. These forecasts have proven tricky through the recession, with most years seeing zero or very modest increases in revenue. Predicting the state of the economy two years into the future is a tricky business. But budget writers will want to get the math right since those revenue forecasts will largely shape the spending options available in the next budget.
Tailwinds To Headwinds
What’s Next? 16
What Should We Invest In? • Human Capital • Economic Creativity • Business Base • Costs of Business? • Infrastructure? • Quality of Life?
Human Capital Adults with a BA or Better Per Pupil Spending 2011 8th grade NAEP Math Score 2011 8th grade NAEP Science Score Economic Creativity Patents Per Capita Venture Capital Per Capita R and D (% of GDP) Doctorates per Capita Business Base Per Capita Income High Tech Jobs as % of Total Business Birth and Death Rate Internet Usage Costs Health Care Cost Per Capita Commercial Energy Costs Per Kilowatt Housing Affordability Mature Firm Tax Burden Infrastructure State Debt per Capita Percent of bridges in trouble Transportation spending per capita Road conditions (roughness) Innovation and Costs
Translate into Public Policy With Whom Are We Competing?
Housing Relative to Income Less Affordable
Survey data needs to be carefully assessed • Surveys tell a very different story on regulatory status depending on what is measured and what is weighted more heavily • Forbes survey ranks NH 48th lowest in terms of regulatory structure. • Kaufmann survey ranks NH high across a series of regulatory structures small businesses. • Given the importance, we are looking to collect primary data on this topic.
New Hampshire Center for Public Policy Studies Board of Directors Sheila T. Francoeur, Chair David Alukonis Michael Buckley William H. Dunlap Eric Herr Richard Ober James Putnam Stephen J. Reno Stuart V. Smith, Jr. Donna Sytek Brian F. Walsh Martin L. Gross, Chair Emeritus John D. Crosier, Sr., Todd I. Selig Kimon S. Zachos Directors Emeritus Want to learn more? • Online: nhpolicy.org • Facebook: facebook.com/nhpolicy • Twitter: @nhpublicpolicy • Our blog: policyblognh.org • (603) 226-2500 “…to raise new ideas and improve policy debates through quality information and analysis on issues shaping New Hampshire’s future.” 38