Download
1 / 22
220 likes | 352 Views
Surface Wind Speed Simulations in the NARCCAP Models. Rachel Hatteberg and Eugene S. Takle Iowa State University NARCCAP Fourth Users Meeting Boulder,CO 10-11 April 2012 . Presented by Bill Gutowski. Outline. Spectra of winds from NARCCAP models for NCEP-driven runs

E N D
Surface Wind Speed Simulations in the NARCCAP Models Rachel Hattebergand Eugene S. Takle Iowa State University NARCCAP Fourth Users Meeting Boulder,CO 10-11 April 2012 Presented by Bill Gutowski
Outline • Spectra of winds from NARCCAP models for NCEP-driven runs • Representation of extreme high winds in NARCCAP models • Impact of climate change on wind spectra in NARCCAP models • Representation of extreme low winds in NARCCAP models • Peculiar behavior of MM5 at low wind speeds
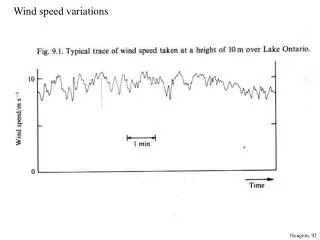
Background on Study May – September (original objective was to look at derechoes) 3 – hourly instantaneous wind speeds 10 m u, v wind components Calculated U = (u^2 + v^2)^1/2 Domain = 37°N to 49°N, -82°W to -101°W Domain allowed for minimal orographic affects Masked out Great Lakes
What Does a Regional Climate Model with 52-km Grid Spacing Consider to be an “Extreme” High Wind?
What Does a Regional Climate Model with 52-km Grid Spacing Consider to be an “Extreme” High Wind? 800,000 - 1,100,000 modeled wind speeds in each distribution
What Does a Regional Climate Model with 52-km Grid Spacing Consider to be an “Extreme” High Wind? Note. (More on this later) 800,000 - 1,100,000 modeled wind speeds in each distribution
What Does a Regional Climate Model with 52-km Grid Spacing Consider to be an “Extreme” High Wind? How extreme? 95%? 99?
What Does a Regional Climate Model with 52-km Grid Spacing Consider to be an “Extreme” High Wind? Message: RCMs differ in their representation of surface winds. This has implications for applications to studies of evapotranspiration, air pollution, extreme wind characteristics
Effect of Climate Change on Surface Winds Result: CRCM/CGCM3: Overall decrease in surface winds
Effect of Climate Change on Surface Winds Result: RCM3/CGCM3: Overall decrease in surface winds
Effect of Climate Change on Surface Winds Result: RCM3/GFDL: Yo, what’s this?! Change at night but not day? More/fewer traveling synoptic systems? Must be introduced by GCM (see previous slide)
Effect of Climate Change on Surface Winds Result: MM5I/CCSM: Hmm… Not only GFDL creates this peculiar behavior
Summary of Influence of Climate Change on RCM/GCM Percentiles Result: Large decrease in extreme high end; less change to mode or low end
What about the peculiar behavior of low wind speeds in MM5? MM5 WRF
What about the peculiar behavior of low wind speeds in MM5? Calm happens! – especially in flat terrain mid-continent areas. If model winds are extrapolated from lowest model level to zero at the surface, the wind at 10 m should almost never be zero. BUT, MM5 spectra looks more realistic than others compared to observed winds in Midwest – for some wrong reason?
What about the peculiar behavior of low wind speeds in MM5? Choice of model could have high impact for studying air pollution stagnation events, heat waves, and agricultural applications (e.g., irrigation, evapotranspiration, pollen spread). This MM5 behavior is present in future scenario simulations and in simulated values over the entire year (not just May-August)
Summary • For the Upper Midwest domain and time period studied, NARCCAP models show some differences in wind speed spectra, particularly at extreme high values • Wind speeds decline with climate change, although peculiar behavior is shown for some RCM/GCM combinations • MM5 has a unique representation of extreme low wind speeds for reasons yet unknown Sooo, for those of you who may have thought RCMs were orderly and systematic….