Download
1 / 14
150 likes | 305 Views
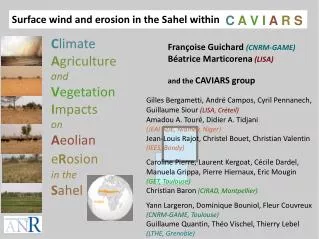
C A V I A R S. Surface wind and erosion in the Sahel within. C limate A griculture and V egetation I mpacts on A eolian e R osion in the S ahel. Françoise Guichard (CNRM-GAME) Béatrice Marticorena (LISA) and the CAVIARS group

E N D
C A V I A R S Surface wind and erosion in the Sahel within Climate Agriculture and Vegetation Impacts on Aeolian eRosion in the Sahel Françoise Guichard(CNRM-GAME) Béatrice Marticorena(LISA) and the CAVIARS group Gilles Bergametti, André Campos, Cyril Pennanech, Guillaume Siour(LISA, Créteil) Amadou A. Touré, Didier A. Tidjani (JEAI ADE, Niamey, Niger) Jean-Louis Rajot, Christel Bouet, Christian Valentin (IEES, Bondy) Caroline Pierre, Laurent Kergoat, Cécile Dardel, Manuela Grippa, Pierre Hiernaux, Eric Mougin (GET, Toulouse) Christian Baron (CIRAD, Montpellier) Yann Largeron, Dominique Bouniol, Fleur Couvreux (CNRM-GAME, Toulouse) Guillaume Quantin, Théo Vischel, Thierry Lebel (LTHE, Grenoble)
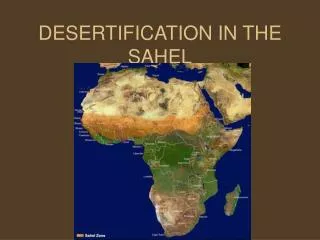
Agoufou, Mali July August October Background sharp meridional gradient of rainfall 100 to 600 mm /year , semi-arid to arid Multi-decadal climatic variability 1950-1970 : wetter, 1970-1985 : drought Annual precipitation Climate variability (mm) 900 15 700 500 10 300 -15 -10 -5 0 5 10 15 20 (Lebel and Ali, 2009) Low vegetation cover, strong annual Dynamics Sharp decrease during drought decades long term variability linked to Precipitation (Olson et al., 2005) A recent regreening from satellite data, consistent with in-situ data (Dardel et al. 2014) NDVI trends over 1981-2011 (Olsson et al., 2005)
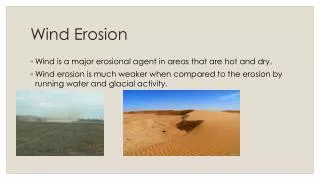
Background increase of aeolian erosion, coupled with change in precipitation magnitude of recent activity higher than prior to the 70's 80's droughts (Dumay et al. 2002) erosion mostly observed over bare soil crops, prior to rain during convective events (Rajot 2001) A tendency for more crops and less natural vegetation and pastures (Hiernaux and Turner 2002: + 1% à 3% per year, 17 years) Importance of deep convection, convectively-generated cold pools for erosion Marsham et al. (2008, 2011), Heinold et al. (2013) 1996 1997 1998 CROPS FALLOW surface air temperature anomaly surface wind speed 40 km (K) (ms-1) -1 0 1 0 10 -2 20 MIT radar data, Niamey, Lothon et al. (2011) Large Eddy Simulation dx = 200 m (case study of Couvreux et al. 2012)
The C A V I A R Sproject ObjectiveDocumenting changes in aeolian erosion linked to climatic changes and modifications of land use & land cover during the last 50 years StrategyDevelopment of a regional integrative modelling tool to quantifies the different drivers of changes in erosion (land use, aridity…) Validation with data available over the recent past Assessment of the model performance over the last decades (hindcast) Combined/coupled simulations of vegetation and erosion Erosion: DPM Natural vegetation: STEP Crops : SARAH 10°N - 18°N , 20°W - 20°E Dx = Dy = 25 km duration: 5-year periods within [1960,2010] (Pierre et al., 2012) , assuming natural vegetation Special care to input data, improved and/or sensitivity tests Soil and surface databases (texture, size distribution, roughness...), land use, land cover Meteorology: precipitation, temperature, humidity, incoming radiation, surfacewind Erosion ~ U3 (1 + Ut / U) (1- Ut2/U2)
Rain events daily min Wind speed daily max wind speed diurnal cycle Important characteristics of the surface wind in the Sahel Agoufou, Mali (1.5°W, 15.3°N) local data , automatic weather station Guichard et al. J. Hydrology (2009) Strong wind gusts associated with rainfall morning maximum (mixing of low level nocturnal jet) weak nocturnal wind outside of the monsoon season (dry air)
Zoom on a typical example of convective event as seen locally in the Sahel zonal wind wind speed rainfall meridional wind IRT from satellite Most strong wind events involve rainfall (different from the Sahara)
Zoom on an example of convective event as simulated with LES 9 h 12 h Daytime growth of the convective boundary layer Mean wind speed weakens 17 h 18 h Cold pools spreading at the surface with strong winds at their leading edges
Zoom on an example of convective event as simulated with LES 9 h 12 h 17 h 18 h Increase of strongest winds
Wind fields for aeolian erosion models Large area, back in the past: meteorological reanalyses time sampling ~ 3h, dx ~ 50-200 km broad climatology, even if some accuracy issues (models very sensitive to the chosen reanalyse) no parametrization of gusts associated with deep convection (ERA-Interim: diagnotic gust but for DRY convection), anyway too coarse in time and space Observations (5 min avg) Observations (3h-sampled of 15 min-avg) ERA-Interim (dt=3h-sampled) MERRA (dt=1h) NCEP-CFSR (dt=1h) delicate comparison, but some robust differences Largeron et al. (2014) & poster EGU2014-13244 Various attempts to provide a better formulation of wind speed and gust → Several empirical formulations of gusts(Nakamura et al. 1996 and several others) involve strength of cold pool, shear, rainfall (not for erosion purpose) → Redelsperger et al. (2000)mostly for surface sensible and latent heat flux purpose → Cakmur (2004) specifically for dust emission in climate models a limitation to R00 & C04 based on knowledge of deep convection over tropical ocean, very moist environment, weaker downdraughts than over land (different controls & balances)
Approach improvement of reanalyses ERA-Interim wind fields keep it simple, no use of -fragile- output from convective param., PDF, suited for the Sahel • 1) Analysis of AWS data, wind measured with 2D and 3D sonic and cup anemometers • 5 sites in the Sahel, each withseveral years of dataof each type, dt :1 to 5 min • (re)discovered some issues with cup anemometers in convective situations 2) Use results from explicit simulations of Sahelian deep convective events dx = 200 m to 5 km models/runs :MesoNH, AROME, CASCADE UK(Marsham et al. 2011 and others ) to formulate empirical statistical relationships between gust winds & convection • use of precipitation, estimate of the strength of downdraughts, DCAPE, shear... Ug =gustiness = f(rain) , f(Mconv,down)... Ug2 = U2 – Uo2 Simulations on the Equatorial pacific (TOGA-COARE) Redelsperger et al. (2000)
A few preliminary results Monsoon season [10°W-10°E , 10°N-20°N] time sampling = 1 h boxes Ai ~ 100 km x 100 km : compute Ug (Ai , t) CASCADE: 40 days PDF of gustiness Ug using wind at 10 m Precip=0 Precip>0.1 mm Ug f surface rain water dry boxes (P = 0) wet boxes (P > 0.1 mm) AROME: 6 days , dx=4 km (g/kg) using wind at 50 m caution substantial scatter (exploration of DCAPE, shear) quantitative differences among models still, in the Sahel (south of 16°N at least), rainfall appears as informative at 1st order (consistent with local and MIT data) most gust cases occur close to where rain is falling both models generate convectively-driven gust winds, as opposed to models with convective parametrizations which do not display any - consistent with previous CASCADE studies
A few preliminary results parametrizing wind speed PDF CASCADE runs Analytic formula source: Largeron with A & a = f(rainfall)
Summary C A V I A R Saims at documenting changes in aeolian erosion in the Sahel linked to climatic changes & modifications of land use & land cover during the last 50 years via the development and use of a regional integrative modelling tool to quantifies the different drivers of changes in erosion (land use, aridity, climate…) Not fully coupled tool, on purpose : erosion model with a combined dynamic vegetation (natural and crops) but without coupling with the atmosphere Hincast approach, with assessment of the model performance (use of AMMA data) Importance of - work on - the input datasets, among which surface wind speed Need to improve surface wind speeds that are used in this type of study Meteorological reanalyses not well suited for this purpose (Largeron et al. 2014) lacking gust winds induced by convectively-generated cold pools that appear critical for erosion Use of convection-permitting and large eddy simulations to build a parametrization of subgrid-scale wind fields (scale : 80 km x 80 km 'pixel') - CASCADE, AROME, MesoNH In the Sahel, rainfall appears informative, but need to refine the parametrization (DCAPE, wind shear...) - work in progress Exploitation of local datasets (large database), understanding and model evaluation More to come before the end of C A V I A R S, in the next 3 years
5-min average surface wind speed Bamba (17°N) Agoufou (15°N) Banizoumbou (13°N) Day of year