Download
1 / 20
200 likes | 395 Views
Modeling of Passive Microwave Measurements of Surface Wind Speed in Hurricanes. Salem El-Nimri CFRSL Dec. 10 th , 2005. Presentation Outline. Overview Approach RadTb and SFMR Comparisons Development of nadir wind speed model. Development of Incidence angle dependence. Summary. Overview.

E N D
Modeling of Passive Microwave MeasurementsofSurface Wind Speed in Hurricanes Salem El-Nimri CFRSL Dec. 10th , 2005
Presentation Outline • Overview • Approach • RadTb and SFMR Comparisons • Development of nadir wind speed model. • Development of Incidence angle dependence. • Summary
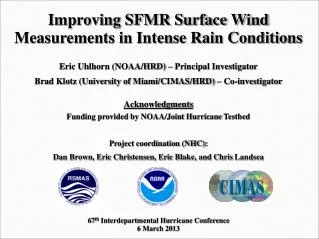
Overview • Hurricane Imaging microwave Radiometer (HiRad) is a proposed airborne/satellite remote sensing instrument for use in hurricane surveillance. • HiRad is an extension of Stepped Frequency Microwave Radiometer (SFMR) remote sensing that has successfully measured surface wind speed and rain rate in hurricanes. • Unlike SFMR, which measures only at nadir, HiRad provides wide swath measurements of ±45 degrees incidence cross-track. • The objective of this work is to develop an improved wind speed model for the CFRSL radiative transfer model, RadTb, based on SFMR measurements, to support HIRad analyses. • Improved at high, hurricane force wind speeds. • Improved incidence angle dependence.
Approach • Tune RadTb at nadir using SFMR hurricane measurements at high wind speeds • Use experimental foam measurements from Melville (2005). • Develop a physically realistic emissivity model in terms of foam fraction and emissivity of foam. • Determine foam emissivity dependence on frequency and incidence angle. • Model off-nadir Tb’s from aircraft banks in hurricanes Fabian 2003 and Katrina 2005 to derive incidence angle dependence for V and H pol., respectively.
SFMR and RadTb Comparison RadTb and SFMR Comparison at 4GHz wso<=33.2 eSFMR= (a1*(ws-wso)+a2*(ws-wso)2)*(1+.15*f) wso>33.2 eSFMR= a1*(ws-wso))*(1+.15*f) eRadTb= FOM*Efoam+(1-FOM)*Erough FOM = Foam Fraction Efoam = Emissivity of Foam Erough = Rough Surface Emissivity
RadTb Deficiencies Foam Fraction Characteristic Emissivity Characteristic at 4 GHz • Foam Fraction exceeds 100 % at 38 m/sec. • Emissivity exceeds 1.0 at 45 m/sec.
Foam Emissivity • Need a formula for the emissivity of foam that is of the form: Efoam=Efoam_freq*Efoam_IE Just as currently in RadTb, from Stogryn. • The Efoam_freq term was modeled using foam data from Melville, et.al. and the nadir looking SFMR wind speed model.
Foam Emissivity Frequency Dependence • Using , Etotal=FOM*Efoam+(1-FOM)*Erough Where, Foam fraction = 100% @ 85 m/sec. and, Efoam_IE=1 Efoam_freq=a0+a1*f, f in GHz.
Foam Fraction Formula • Foam fraction is a function of WS only. • Used the SFMR wind speed forward model and, Etotal=FOM*Efoam+(1-FOM)*Erough • Apply MLE testing principle we get, FOM= a3*ws3 + a2*ws2 +a1*ws + a0
Summary of resultsFabian Sept. 2, 2003 Data set Results 11 turns. 21 banks. WS=7-41 m/sec. EIA=0-35 deg. Accuracy of curve fit, Measure= 0.005-0.01 Modeled= 0.0005-0.005 Measure vs modeled bias, 0.002-0.02 Max difference Measured vs Modeled, 0.001-0.006
Summary • Developed a wind speed model for RadTb that is useful at C-band up to 70 m/sec. at nadir. • Conducting analyses to define incidence angle dependence for H and V polarizations up to 35 deg. • Future Work: • Composite incidence angle dependence for Efoam_ang . • Study measured vs modeled bias • Do the antenna pattern correction • Find the H pol dependence using Katrina