Download
1 / 31
310 likes | 536 Views
AN ENVIRONMENTAL VULNERABILITY PROFILE OF TRINIDAD AND TOBAGO. Environmental Indicators. Meteorological e.g. drought, floods, heat waves, sea surface temperature, high winds Biological e.g. deforestation, endangered species, endemic species, fisheries, human population density

E N D
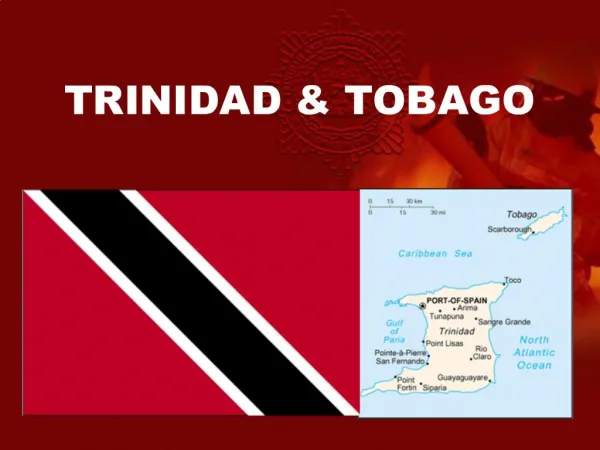
AN ENVIRONMENTAL VULNERABILITY PROFILE OF TRINIDAD AND TOBAGO
Environmental Indicators • Meteorological e.g. drought, floods, heat waves, sea surface temperature, high winds • Biological e.g. deforestation, endangered species, endemic species, fisheries, human population density • Anthropogenic e.g. Oil Spills, Surface Mining, vehicles, pesticides, waste treatment, fertilizers, tourists
1-3 = Not Very vulnerable 4 = Average vulnerability 5 = Vulnerable 6 = Very Vulnerable 7 = Extremely Vulnerable The Environmental Vulnerability of T & T with Respect to each Indicator will be Ranked on a Scale of 1-7
Indicator: Greatest average annual deviation in Sea Surface Temperature in last 5 years compared to the long term mean Answer: 0.7 Indicator Score: 5 Conclusion: T&T vulnerable to coral bleaching etc. Sea Surface Temperature
High Winds Indicator: Number of days over the last 5 years during which the maximum recorded wind speed > 20% higher than the 30 year average maximum for that month Answer: 16 Indicator Score: 3 Conclusion:T & T not very vulnerable to hurricanes, storms etc.
Drought Associated with Low Rainfall • Indicator: Number of months over the last 5 years during which rainfall was >20% lower than the 30 year average for that month. • Answer: 25 times • Indicator Score: 5 • Conclusion: T&T vulnerable to drought
Floods and High Rainfall Events • Question: Number of months over the last 5 years during which rainfall was >20% higher than the 30 year average for that month. • Answer: 13 • Indicator Score: 3 • Conclusion: T&T is not very vulnerable to high rainfall events
Heat Waves • Question: Number of days over the last 5 years during which the maximum temperature was >5 oC higher than the mean 30 year monthly average for that month. • Answer: 1 • Indicator Score: 1 • Conclusion: T&T is not vulnerable to heat waves
Biological Indicators:Endangered and Threatened Species • Question: Number of endangered and threatened species / sq. km. land area. • Answer: 0.2 • Indicator Score: 2 • Conclusion: T&T does not have an exceptional number of endangered or threatened
Extinctions • Question: Number of species which have become extinct since 1900 / sq. km. land area. • Answer: 0 • Indicator Score: 1 • Comment: T&T has only a few endemic species such as the Golden Tree Frog and Pawi
Natural Vegetation Remaining • Question: Percentage of natural and regrowth vegetation remaining (e.g. forests, mangroves, savannah). • Answer: 32.9% • Indicator Score: 4 • Comment: T&T needs to urgently protect its remaining natural vegetation.
Anthropogenic Indicators:Human Population Density • Question: Total human population density / sq. km. land area. • Answer: 266 people/sq. km. • Indicator Score: 7 • Conclusion: Expect significant environmental damage caused by human activities
Human Population Growth Rate • Question: Average Annual human population growth rate (%) over last 5 years • Answer: 1.1 % • Indicator Score: 5 • Conclusion: Population growth rate has been dropping but needs to drop further
Rate of Loss of Natural Vegetation • Question: Net % of land area changed by the removal of natural vegetation over the last 5 years. • Answer: 20.3 % • Indicator Score: 7 • Conclusion: T&T needs to urgently develop an effective system of Parks and Protected Areas
Annual Forest and Bush Fires • Number of fires 1987-1997 = 3441 • Total area burnt = 46,942 ha • Estimate of new areas burnt = 991 ha • Areas reforested by Ministry = 167 ha
Water Pollution • Question: Litre / sq km / day of untreated industrial and domestic wastewater discharged • Answer: 135,146 L / sq km / day • Indicator Score: 7 • Conclusion: T&T has a major untreated wastewater problem
Production of Hazardous and Municipal Wastes • Question: Total net tonnage of generated and net imported toxic, hazardous and municipal wastes / sq km land area / year (averaged over the last 5 years) • Answer: 50 t / sq km /yr • Indicator Score: 5 • Conclusion: T&T has a developing problem with the generation of hazardous wastes
Oil Spills • Question: Number of spills of oil and hazardous substances >1000 litres during last 5 years on land, in rivers or within territorial waters / sq. km. land area (*1000). • Answer: 240 • Indicator Score: 7 • Conclusion: T&T is extremely vulnerable to oil pollution problem
Oil Spills • 1996 274 • 1997 244 • 1998 298 • 1999 209 • 2000 244
Air Pollution from Vehicles • Question: Number of vehicles / sq. km. land area. • Answer: 57 • Indicator Score: 7 • Conclusion: Possible pollution problem from vehicles e.g. lead, SOx, NOx
Habitat Disturbance by Surface Mining • Question: % Land, rivers and coastal zone affected by mining and quarrying • Answer: 2.4 % • Indicator Score: 4 • Conclusion: T&T does not have a widespread problem from surface mining
Sub-surface mining Indicator: Tonnes of mining material (ore+tailings) extracted / sq km land area / year (average last 5 years) Answer: 4319 Indicator Score: 7 Conclusion: T&T extremely vulnerable to pollution, habitat disturbance, heavy industry
Priorities for Action(Indicators Scoring 7) • Population Density • Deforestation • Water Pollution • Air Pollution from Vehicles • Oil Spills on Land • Sub-surface mining
Secondary Problems(Indicators Scoring 5 or 6) • Human Population Growth Rate • Drought during the Dry season • Production of Hazardous and Municipal Wastes
Anthropological Biological Country Characteristics Geological Meteorological
Draft EVI for Caribbean Countries • Index Rank/235 • Trinidad and Tobago 3.92 18 • Meteorological factors 2.83 • Geological factors 1.33 • Biological factors 3.00 • Country Characteristics 2.67 • Anthropogenic factors 5.00
Draft EVI for Caribbean Countries • Index Rank • Barbados 4.17 6 • Meteorological factors - • Geological factors 1.00 • Biological factors 5.83 • Country Characteristics 3.50 • Anthropogenic factors 4.56
Draft EVI for Caribbean Countries • Index Rank • Jamaica 3.8 22 • Meteorological factors - • Geological factors 1.50 • Biological factors 4.25 • Country Characteristics 3.83 • Anthropogenic factors 4.15
Draft EVI for Caribbean Countries • Index Rank • Saint Lucia 3.64 37 • Meteorological factors - • Geological factors 1.00 • Biological factors 6.00 • Country Characteristics 3.60 • Anthropogenic factors 2.88