Download
1 / 49
490 likes | 635 Views
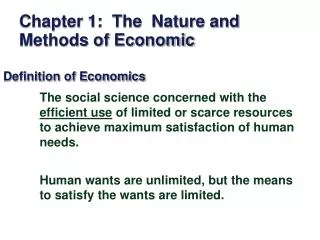
Objective 1: The Nature of science . The Scientific Method. An organized procedure to solve a problem, evaluate a procedure or set of situations. A way of looking at things that is based on observations and data. Evaluating the data and coming up with conclusions based on data.

E N D
The Scientific Method An organized procedure to solve a problem, evaluate a procedure or set of situations. A way of looking at things that is based on observations and data. Evaluating the data and coming up with conclusions based on data. The conclusion can be positive, negative, or undetermined.
Scientific Method Procedures • Observation • The foundation of the scientific method • Leads to a question regarding the event or characteristic • Hypothesis • Is an “educated guess” • It is a tentative cause and effect statement • Has to be testable • Is rejected or accepted at the conclusion of an experiment
Terminology • Hypothesis: a possible answer to a scientific question Q: “How will studying affect my test score?” Hypothesis: “If I study for… then my test score will…” • Prediction: states the expected outcome of an experiment designed to test the hypothesis “My test score will increase.” • Inference: a logical interpretation based on prior knowledge and experience “I have always done poorly in science, so I will do poorly this time too.” or “If I study more, I will be prepared, and I will do better.
Scientific Method Procedures • Experiment • Experiments must be repeatable and reproducible • independent variable - this will be the single variable you elect to manipulate or change. • dependent variable - this will be the single observation, or the result you will be observing and measuring. • controlled variables - these are factors that you will keep constant (“keep controlled”) during the experiment, so that they do not affect the dependent variable.
Scientific Method Procedures • Collect/ Analyze Data • Always report ALL results (the good, the bad, and the ugly!) • Look for patterns in the data. Make charts and graphs • Conclusion • Look for what happened and why it happened. • Look for trends and patterns. • Make a statement on what you see. • A no difference is an OK conclusion.
Predicting Trends in Data • You will be asked to make a conclusion or make a prediction based on information that they give you. • Test Taking Tip: When you are drawing a conclusion or predicting a trend in the data, you have to base your answer on the data given. • This means that they have to give you the answer! • Do NOT rely on anything but what is given to you. • If an answer choice is about something not mentioned or goes against the given data, it is NOT the right answer. • On TAKS, there should be an obvious connection. • Look for the connection in the statement of the problem. • Look for what is held the same and what is changed and measured.
Graphs & Charts A picture is worth a 1000 words. A chart is a way or organize data. A graph is a picture of the data that helps you see trends and patterns.
Circle Graphs or Pie Graphs • A circle graph is used when you are showing parts of a whole or percentages of a total.
A Line or Scatter Graph • A line or scatter graph is used when you are trying to show a connection between to variables. • How does what you change (the independent variable; usually on the x-axis) connect to the thing you measure (the dependent variable; usually on the y-axis). • When you have two sets of numerical data, you use a line graph.
Line Graph • Line graphs are used when one variable (the independent variable, the year) affects another variable(the dependent, the number of graduates) .
Bar Graphs • The data for this graph are non-numerical and discrete for at least one variable. • There are no dependent and independent variables. • Axes may be reversed to give graph with the categories on the x axis. • Bar graphs can therefore be drawn horizontally or vertically. • This type of graph is very useful for comparing two or more similar items.
Graphs ? • Be able to read them. Look at each axis for clues. • Look for units. • Look for trends and be able to predict what may happen next. • For TAKS, the independent variable, the one you change or manipulate is graphed on the x-axis. The dependent variable, the one you measure, or the one that responds to the changes you made, are graphed on the y-axis. • Dry Mix : Dependent, Responsive on Y-axis : Manipulated, Independent on the X-axis.
Safety Know the lab safety symbols and procedures.
Be Safe • ALWAYS WEAR GOGGLES and APRONS when told to do so! • ALWAYS POUR ACID SLOWLY INTO WATER! NEVER water into acid! • Water and electricity do not mix. • Never work alone in the lab. • Long hair tied back. • Wear proper clothing. • Wear closed toe shoes. • Do not eat or drink in the lab. • No playing in lab area. • Read the MSDS sheets before working with chemicals. • Dispose of chemicals and materials properly. • Know where the safety equipment is located: eye wash, fire extinguisher, shower, exits, … • Do not wear rubber gloves when dealing with heat. Rubber melts.
Safety with Gases or Inhalants • Do not inhale any gas or vapor unless directed to do so by your teacher. • WAFT any scent to your nostrils to ensure that you do not destroy the mucus membranes of your respiratory system. • Handle materials that emit vapors or gases in a fume/ vent hood. • Work in a well ventilated room. • Use common sense.
Accidents, Injuries, Equipment Breaks • Report any accident or injury to your teacher IMMEDIATELY! • If you cannot notify the teacher because of your injury – have your lab partner tell the teacher!
Use Common Sense • When using scalpels, sharp probes, and knives do not cut objects while holding them in your hand. • Cut objects on a suitable work surface. Always cut in a direction away from your body. • Hot glass looks like cold glass. • Use tongs or insulated/ thermal holders when handling heated objects. • Never point the open end of a test tube at yourself or others when heating it
The 4 C’s • Caustic: capable of burning, corroding, or destroying living tissue. • Carcinogen: any substance or agent that tends to produce a cancer • Corrosive: having the quality of corroding or eating away • Combustible: capable of catching fire and burning
Radioactive, Toxic, Bio Hazard Run Away
Lab Equipment • Know what you need to measure different quantities. • Clock or Stopwatch to measure time • Balance to measure mass, (weight) • Graduated cylinder, buret, beaker, flask to measure liquid volume • Ruler to measure distance • pH meter to measure pH: acidity or bascity • Litmus paper indicates base or acid • Thermometer to measure heat or temperature
Lab Equipment • Know proper procedures for using a balance, burner, water bath • Know that the instrument with the most (finest) markings (or divisions) is the most precise and most accurate. • Be able to read the instrument with units and find the difference between readings.