Download
1 / 70
750 likes | 921 Views
Hybrid Solar Vehicles: Perspectives, Problems, Management Strategies. HYATT REGENCY NOVEMBER 13-14, 2008 ISTANBUL. I.Arsie, G.Rizzo , M.Sorrentino DIMEC, University of Salerno, Italy. Outline. Introduction HSV: models and results Optimization of Management Strategies The Prototype

E N D
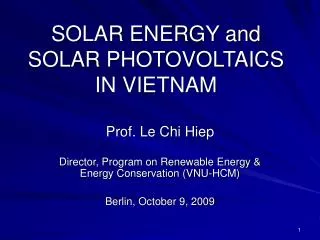
Hybrid Solar Vehicles: Perspectives, Problems, Management Strategies INTERNATIONAL CONFERENCE ON AUTOMOTIVE TECHNOLOGY ICAT06, NOVEMBER 17, 2006, ISTANBUL HYATT REGENCY NOVEMBER 13-14, 2008 ISTANBUL I.Arsie, G.Rizzo, M.SorrentinoDIMEC, University of Salerno, Italy
Outline INTERNATIONAL CONFERENCE ON AUTOMOTIVE TECHNOLOGY ICAT06, NOVEMBER 17, 2006, ISTANBUL • Introduction • HSV: models and results • Optimization of Management Strategies • The Prototype • Conclusions
The background Serious alarms about global warming and climate changes related to CO2 concentration in the atmosphere CO2 emission for transport is increased in last 30 years both in relative and absolute values. (UK data. Similar trends hold in Western countries). Growing demand for mobility. The Chindia factor, 1/3 of world population. 400% and 205% increase in cars for China and India from 1990 - 2000
From conferences to cartoons INTERNATIONAL CONFERENCE ON AUTOMOTIVE TECHNOLOGY ICAT06, NOVEMBER 17, 2006, ISTANBUL
Possible Solutions? INTERNATIONAL CONFERENCE ON AUTOMOTIVE TECHNOLOGY ICAT06, NOVEMBER 17, 2006, ISTANBUL • Kyoto Protocol: A possible solution to fossil fuel depletion and global warming is an increased recourse to Renewable Energy (RE). • Possible application to cars: • Fuels/Energy from RE (Bio-Fuels, H2) • Solar Cars
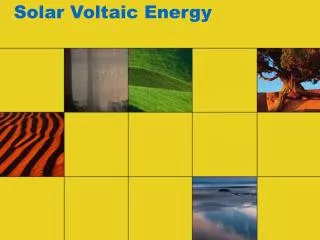
1.5 106 km A very small part of the energy radiated by sun strikes the Earth (a part over two billions). Nuclear fusion into the sun produces an enormous amount of energy, irradiated into the space. Solar energy is partly reflected to the space (15%), partly used to evaporate water (30%) and partly absorbed by plants, oceans and land, and for men use (55%). Solar Energy INTERNATIONAL CONFERENCE ON AUTOMOTIVE TECHNOLOGY ICAT06, NOVEMBER 17, 2006, ISTANBUL
= + Solar Energy vs. Energy Consumption INTERNATIONAL CONFERENCE ON AUTOMOTIVE TECHNOLOGY ICAT06, NOVEMBER 17, 2006, ISTANBUL The solar energy striking the US in one day is almost equivalent to the energy consumption for one and a half year
PV Panels INTERNATIONAL CONFERENCE ON AUTOMOTIVE TECHNOLOGY ICAT06, NOVEMBER 17, 2006, ISTANBUL Today's most common PV devices use a single-junction with poli-crystalline silicon, with efficiency of about 12% Use of mono-crystalline silicon results in higher efficiency (15% and more) Multi-junction cell Much of today's research in multi-junction cells focuses on gallium arsenide as one of the component cells. Such cells have reached efficiencies of around 40% under concentrated sunlight (Fresnel lens).
PV efficiency trends INTERNATIONAL CONFERENCE ON AUTOMOTIVE TECHNOLOGY ICAT06, NOVEMBER 17, 2006, ISTANBUL
Solar Panels Production and Prices INTERNATIONAL CONFERENCE ON AUTOMOTIVE TECHNOLOGY ICAT06, NOVEMBER 17, 2006, ISTANBUL The production of photovoltaic panels has remarkably increased since 90’s in terms of installed power. Their cost, after a continuous decrease and an inversion of the trend occurred in 2004, appears now quite stable
Outline INTERNATIONAL CONFERENCE ON AUTOMOTIVE TECHNOLOGY ICAT06, NOVEMBER 17, 2006, ISTANBUL • Introduction • HSV: models and results • Optimization of Management Strategies • The Prototype • Conclusions
Solar Cars INTERNATIONAL CONFERENCE ON AUTOMOTIVE TECHNOLOGY ICAT06, NOVEMBER 17, 2006, ISTANBUL Various propotypes of solar cars have been developed, for racing and demonstrative use
Limits of Solar Cars INTERNATIONAL CONFERENCE ON AUTOMOTIVE TECHNOLOGY ICAT06, NOVEMBER 17, 2006, ISTANBUL • Solar Cars do not represent realistic alternative to “normal” cars, due to: • Limited power and performance. • Limited range. • Discontinuous energy source. • High cost.
Hybrid Electric Vehicles F.Porsche, 1900 Buick Skylark, 1974 Toyota Prius Ford Escape Honda Insight GM Precept Mercedes S400 Hybrid-Diesel Peugeot 308 Hybrid-Diesel
HEV and PV: a possible marriage? INTERNATIONAL CONFERENCE ON AUTOMOTIVE TECHNOLOGY ICAT06, NOVEMBER 17, 2006, ISTANBUL
Solar Cars: lighter than Cars HEVs: heavier than Cars Q: Is solar energy a rich dowry for a vehicle? About the dowry INTERNATIONAL CONFERENCE ON AUTOMOTIVE TECHNOLOGY ICAT06, NOVEMBER 17, 2006, ISTANBUL
Daily time fraction spent in parking mode Daily time fraction spent in driving mode Parking mode Driving mode Energy Balance in a Solar Car INTERNATIONAL CONFERENCE ON AUTOMOTIVE TECHNOLOGY ICAT06, NOVEMBER 17, 2006, ISTANBUL Net solar energy available to propulsion [KWh/day] esun=average insolation (KWh/m2day) APV=effective panel area = APV,H+0.5 APV,V PV=panel efficiency (=0.13) : reduction factor due to charge/discharge processes in battery (=0.9) : insulation reduction during driving, due to shadow (=0.9)
Solar Fraction Continuous use (h=10) with 100% recourse to the sun can be achieved only at very low power (<1 KW). 6 m2@12% or 3 m2@24% Driving hours per day Solar energy can represent a significant contribution for intermittent use (h=1-2) and for limited average power. For average power from 5 to 10 KW and driving hours from 1 to 2, solar contribution ranges from 18% to 60%. Are these values of power and driving hours significant? Site: San Antonio, Texas Yearly Averaged Data
Statistics on Car Drivers INTERNATIONAL CONFERENCE ON AUTOMOTIVE TECHNOLOGY ICAT06, NOVEMBER 17, 2006, ISTANBUL Some recent studies of the UK government stated that • about 71% of UK users reaches their office by car • 46% of them have trips shorter than 20 min • mostly with only one person on board. Source: Labour Force Survey, http://www.statistics.gov.uk/CCI/nscl.asp?ID=8027
Power Demand INTERNATIONAL CONFERENCE ON AUTOMOTIVE TECHNOLOGY ICAT06, NOVEMBER 17, 2006, ISTANBUL Extra-urban Urban Power demand can be determined integrating the longitudinal vehicle model over a mission cycle. During urban drive, limited average power can be required to drive a small car. Mass=1000 Kg - Length=3.75 m
Negligible differences between 2-axis and 1-axis tracking systems. Effects of Position on Energy INTERNATIONAL CONFERENCE ON AUTOMOTIVE TECHNOLOGY ICAT06, NOVEMBER 17, 2006, ISTANBUL Average Yearly Energy (KWh/year) Almost a factor 2 between maximum and minimum latitudes. 46% For fixed panels, there is not a relevant loss by adopting horizontal position with respect to “optimal” tilt, particularly at low latitudes. 79% Energy absorbed with vertical position is significantly lower, mainly at low latitudes. Adoption of moving solar roof for parking phases can significantly increase solar energy, particolarly at the high latitudes Latitude (deg)
Some HSV prototypes INTERNATIONAL CONFERENCE ON AUTOMOTIVE TECHNOLOGY ICAT06, NOVEMBER 17, 2006, ISTANBUL Viking 23 Western Washington University Tokyo University of Agriculture and Technology Ultra-Commuter The University of Queensland Solar Toyota Prius By Steve Lapp
Solar Prius INTERNATIONAL CONFERENCE ON AUTOMOTIVE TECHNOLOGY ICAT06, NOVEMBER 17, 2006, ISTANBUL Prius with an aftermarket 215 W monocristalline solar module with peak power tracking and a 95% efficiency DC-DC Converter It is estimated that the PV Prius will consume somewhere between 17% and 29% less gasoline than the stock Prius (range per day: 5-8 miles)
H2 Well to Wheel
HSV vs HEV HEV ≠ Conventional Car + Electric Motor HSV ≠ HEV + PV
HSV vs HEV INTERNATIONAL CONFERENCE ON AUTOMOTIVE TECHNOLOGY ICAT06, NOVEMBER 17, 2006, ISTANBUL • Mission profile (HSV should be optimized for urban driving) • Different SOC management strategies. • Different structure (vehicle dimension, hybrid architecture)
SOC In most HEVs, a charge sustaining strategy is adopted: the battery State Of Charge (SOC) is unchanged within a driving path. driving path Time SOC day A suitable strategy for HSV instead can restore the initial SOC within a whole day, considering battery charging during parking time. driving path parking ΔSOC Time Charge depletion HSV vs HEV control
Potential advantages of Series HSV • No mechanical link between generator and wheels: • Very effective vibration insulation can be achieved • Less constraints for vehicle layout • Possible use of in-wheel motors with advanced traction control techniques • Engines optimized for steady operation can be used: • ICE designed and optimized for steady conditions • D.I. Stratified charge engine (4 or 2 strokes) • Micro gas turbine • Series architecture acts as a bridge towards the introduction of fuel cell powertrains. • More suitable for V2G applications
Vehicle to Grid (V2G) INTERNATIONAL CONFERENCE ON AUTOMOTIVE TECHNOLOGY ICAT06, NOVEMBER 17, 2006, ISTANBUL • V2G concept: to connect parked electric driven vehicles (electric, hybrid, hybrid solar, fuel-cell) to the grid by a two-way computer controlledhook up. • The power capacity of the automotive fleet is about 10 times greater than the electrical generating plants (in US) and is idle over the 95%. • Advantages: • Reductionofcostsforpeakpower production. • Toward the distributed generation, withreductionofTransmission and Distribution (T&D) costs. • Facilitate integrationofintermittentrenewableresources. • The valueof the utilityexceeds the costsfor the two-wayhook up and for the reducedvehiclebattery life.
V2G: Additional advantages for HSV INTERNATIONAL CONFERENCE ON AUTOMOTIVE TECHNOLOGY ICAT06, NOVEMBER 17, 2006, ISTANBUL • Possibility to transfer excess solar power to the grid • Possible use of moto-generator as cogenerator for domestic use
A B Part load operation can be avoided and substituted by intermittent operation at maximum efficiency Engine control in a series HSV In a series HSV, the Internal Combustion Engine could operate on the optimum efficiency curve and whenever possible at its maximum efficiency ICE Efficiency ICE Power
SHM – Operating Modes /1 INTERNATIONAL CONFERENCE ON AUTOMOTIVE TECHNOLOGY ICAT06, NOVEMBER 17, 2006, ISTANBUL Parking PV Panels with sunlight VMU ICE EG EM Battery
SHM – Operating Modes /2 INTERNATIONAL CONFERENCE ON AUTOMOTIVE TECHNOLOGY ICAT06, NOVEMBER 17, 2006, ISTANBUL Hybrid PV Panels with sunlight VMU ICE EG EM Battery
SHM – Operating Modes /3 INTERNATIONAL CONFERENCE ON AUTOMOTIVE TECHNOLOGY ICAT06, NOVEMBER 17, 2006, ISTANBUL Electric Driving PV Panels with sunlight VMU ICE EG EM Battery
SHM – Operating Modes /4 INTERNATIONAL CONFERENCE ON AUTOMOTIVE TECHNOLOGY ICAT06, NOVEMBER 17, 2006, ISTANBUL Regenerative Braking PV Panels with sunlight VMU ICE EG EM Battery
SHM – Operating Modes /5 INTERNATIONAL CONFERENCE ON AUTOMOTIVE TECHNOLOGY ICAT06, NOVEMBER 17, 2006, ISTANBUL Recharge from grid PV Panels with sunlight VMU ICE EG EM Battery
SHM – Operating Modes /6 INTERNATIONAL CONFERENCE ON AUTOMOTIVE TECHNOLOGY ICAT06, NOVEMBER 17, 2006, ISTANBUL “We believe that the most plausible vehicle of the future is a plug-in hybrid...” (Center for Energy and Climate Solutions, 2004) Power to grid (V2G) PV Panels Thermal load with sunlight heat VMU ICE EG EM Battery
Flow Chart INTERNATIONAL CONFERENCE ON AUTOMOTIVE TECHNOLOGY ICAT06, NOVEMBER 17, 2006, ISTANBUL CONTROL VARIABLES Control Strategy for EG – MPPT for PV DESIGN SPECIFICATION Power demand – Insolation – HSV Structure DESIGN VARIABLES PV Panel Area and Position – EG and EM Power – Car dimensions – Materials EXHOGENOUS VARIABLES Fuel Price – Panel Efficiency – Unit weight and costs MODELS Energy Flows for HSV/CC – Car sizing - Weight - Cost OUTPUT Car Stability – Fuel Savings – Weight - Payback Objective Function and Constraints
Payback Optimization INTERNATIONAL CONFERENCE ON AUTOMOTIVE TECHNOLOGY ICAT06, NOVEMBER 17, 2006, ISTANBUL Objective Function: minimum Payback Inequality Constraints • Design variablesX: • Electric Generator Power PEG • Electric Motor Power PEM • Horizontal panel area APV,H • Vertical panel area APV,V • Car length l • Car width w • Car Height h • Weight reduction factor of car chassis with respect to base value CWf Solved by Sequential Quadratic Programming (Matlab routine FMINCON)
Power to Weight ratio equal to the conventional vehicle Car dimensions within assigned limits, obtained by the database of commercial vehicles Length to width ratio and height to width ratio within assigned limits, obtained by the database of commercial vehicles PV panels area compatible with car dimensions, according to the given geometrical model Car weight reduction factor not lower than 0.7 Constraint Specification INTERNATIONAL CONFERENCE ON AUTOMOTIVE TECHNOLOGY ICAT06, NOVEMBER 17, 2006, ISTANBUL EG Power within lower and upper bounds
A very good payback (2.4 years) is by doubling fuel cost, reducing by 4 panel cost, and considering 16% panel efficiency Optimal design results PV Retail Price: June 2008: 4.70 €/W Fuel Price ≈ 2.1 €/KG Italy, June, 2008
MPPT Techniques INTERNATIONAL CONFERENCE ON AUTOMOTIVE TECHNOLOGY ICAT06, NOVEMBER 17, 2006, ISTANBUL Uniform working conditions • Due to changing sun irradiance, PV source must be matched to the load to draw maximum power. • Maximum Power Point Tracking (MPPT) techniques are adopted. • The presence of local maxima occur during mismatched conditions, due to shading effects and temperature variations in different parts of the panel. • The characteristic may change rapidly during driving conditions, required advanced MPPT control. Mismatched PV field Power vs. voltage characteristic of a PV field
Sources of mismatching INTERNATIONAL CONFERENCE ON AUTOMOTIVE TECHNOLOGY ICAT06, NOVEMBER 17, 2006, ISTANBUL • Different solar irradiation levels due to: • Clouds • Shadows • Different orientation of parts of the PV field • Dirtiness • Tolerances (due to manufacturing and/or ageing) • Different types of panels (different models, photo-glass, coloured) in the same string
MPPT management of PV array • MPPT strategy are implemented to maximizing PV efficiency throughout the day. •Max Allowable Power • Power given to the battery P Vi MPPT Vi
Outline INTERNATIONAL CONFERENCE ON AUTOMOTIVE TECHNOLOGY ICAT06, NOVEMBER 17, 2006, ISTANBUL • Introduction • HSV: models and results • Optimization of Management Strategies • The Prototype • Conclusions
HSV Modeling Longitudinal model of the HSV protoype: Power at wheels EM Power Battery recharge power = experimentally characterized
Experimental characterization: EG and EM The electric generator was characterized connecting a pure resistive electrical load. A 4° order polynomial regression was obtained. • EM efficiency is modeled by a 3rd order polynomial regression identified vs. manufacturer technical data.
Experimental characterization: the Battery pack Battery is modeled applying the Kirchoff law to an equivalent circuit. The internal resistance was modeled as a nonlinear function of state of charge. Model accuracy was checked against experiments.
Experimental characterization: the PV array The PV array has been characterized by connecting the converter output to a resistive load. hPV = 10 % (390 W/m2 irradiation) • The average PV daily energy was derived from an experimental year-thorough distribution:
ICE thermal transients ICE operation Tss [°C] K [s] ON 82 150 OFF 27 600 Engine temperature dynamics is estimated by a first order dynamic model Steady state temperatures and time constants are assigned for ICE on and ICE off events