Download

1 / 14
180 likes | 625 Views
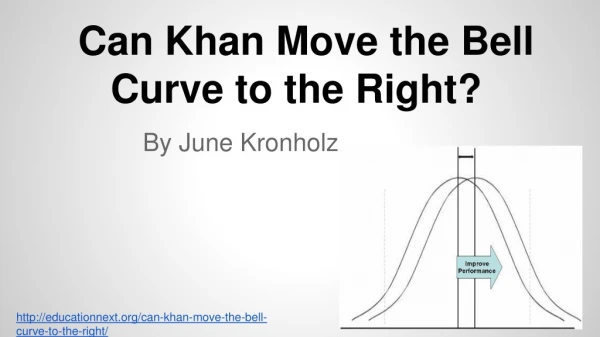
Shaping the Bell Right. Vitality Curve. The Normal Distribution Curve is used as tool in measuring human capacities, Pioneered by the leader Jack Welch former CEO of GE It is a differentiation tool used to assess an employee’s performance and promotability

E N D
Vitality Curve • The Normal Distribution Curve is used as tool in measuring human capacities, Pioneered by the leader Jack Welch former CEO of GE • It is a differentiation tool used to assess an employee’s performance and promotability • Jack called it as ‘Vitality Curve'. Also known as - Dead man’s Curve - Forced ranking - Rank and yank - Up or Out
Grading the curve • The employee force is ranked into a 20-70-10 bucket. • Where 20 percent are rated as 'excellent‘ • 70 percent as the ‘vital’ - back bone of the company • 10 percent as ‘bottom-feeders’
Cont.. Illustratively, it is to show appraisers that, • Not more than 10% should be promoted in each department • Least 10% must be weeded out for low performance; • The rest being rated from average, good to very good.
Advantages of Vitality Curve in PAM • It brings objectivity to the PAM process • It helps in normalization of the appraisal process • It lends itself to predictable performance patterns • It guides appraisers on how to follow an uniform rating process/pattern • It helps management in planned attrition and in predicting promotions/job enlargements/job enrichments/rewards/incentives, etc.
Cont.. • It systematically identifies high performers for commensurate rewards and identifies low/weak performers for training/forced attrition. • On a predictive index, it provides a bird's eye view of the uniform, systematic performance patterns across grades/levels/functions in the organization.
Disadvantages of Vitality Curve in PAM • It seems rigid and impractical, especially for small/medium. It may reduce organizational flexibility. • It does not promote 'performance adjustments' • It makes 'extreme raters" skeptical since it does not allow them to rate as they wish causing anxiety or discontentment • It may be difficult to simulate/follow since outstanding performers or weak performers may not essentially be 10%-20% , year-on- year.
Cont.. • The methodology may not be easily understood by all appraisers • Training inadequacy in appraisers may yield disastrous results • Implementation may be difficult since HR has to ensure constant compliance. • Being a 'forced-distribution' method, it may face dissent from appraisers • It may not adjust well with skill/managerial demand-supply situations
Arguments against the use of vitality curve in PAM • Unethical- Forcing a certain section of employees every year is unethical says Praneet Mehrish, Country Human Resource Director, ST Microelectronics Ltd. • Subjective- Since the bell curve is applied, not across all the employees, but to individual department / team / function, there is a good chance that the worst in the high performing group may be better than the best in an average performing group. Finally, the company may be left with low performers, while losing some good ones, says Hari Mohan Jha, VP (HR), ITC Welcome Group Hotels
Cont.. • Not compatible for small teams - Logically too, such a model cannot work for a very small group of extremely high or low performers for the simple reason that it force-fits them into predefined compartments. If it works, it can work only for a large, randomly selected sample, says Madhukar Shukla, Professor, XLRI • Dysfunctional work environment - Bell curve method may increase productivity and pave growth opportunities for good performers, it also creates a sense of fear among those who remain behind says EdLawler of Enron
Before you Bell the Curve.. • Use objective parameters for the performance appraisal system. • Confront the employee. There could be reason for his / her poor performance. • Shift the onus of improvement onto the employee, but offer your assistance if needed. • Follow up frequently. • Finally, document all performance-related conversations you have had with the employee in order to have important evidence on your side if he or she contests the termination.