Download
1 / 5
50 likes | 650 Views
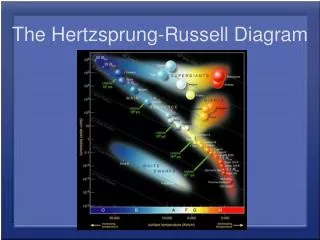
The Hertzsprung-Russell Diagram (a.k.a. H-R Diagram). Star Classification. Stars can be classified in three ways: Size – How massive the star is Temperature – A stars color reveals its temperature. Red stars have a cooler temperature, and blue stars have a warmer temperature.

E N D
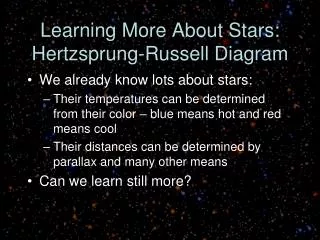
Star Classification • Stars can be classified in three ways: • Size – How massive the star is • Temperature – A stars color reveals its temperature. • Red stars have a cooler temperature, and blue stars have a warmer temperature. • Brightness/Magnitude – The amount of light a star gives off depends on its size and temperature.
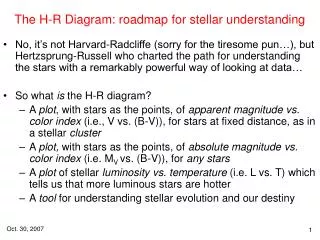
Brightness or Magnitude • How bright a star looks from Earth depends upon both how far the star is from Earth and how bright the star actually is. • A stars brightness can be can be described in two ways: apparent magnitude and absolute magnitude.
Apparent and Absolute Magnitude • Apparent magnitude is the brightness of a star as seen from Earth. • Absolute magnitude is brightness of a star as if it were 32.6 light years from Earth. • The brightness of the stars is compared to the brightness of our Sun. We call this luminosity.
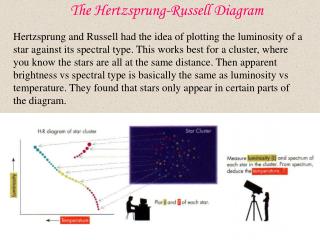
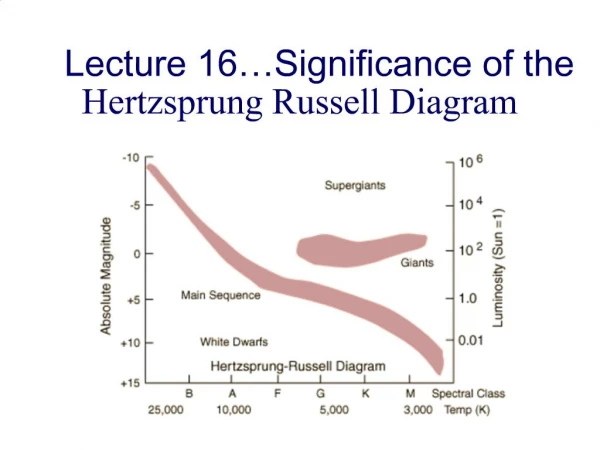
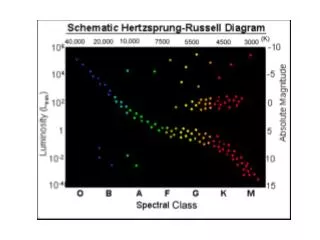
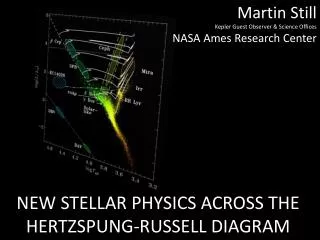
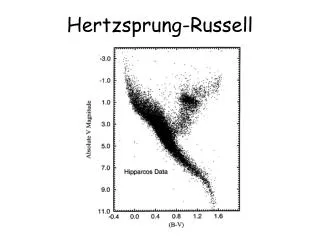
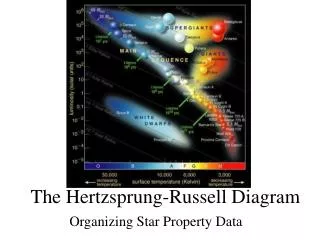
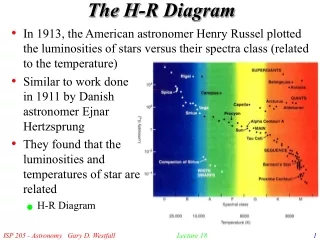
HR Diagram • An HR diagram shows the two most important characteristics of stars, which are temperature and absolutemagnitude (brightness) and/or luminosity. • Scientists plot the surface temperatures of stars and their brightness on a graph.