Download
1 / 53
530 likes | 694 Views
Learn about the systematic way to discuss physical changes in mixtures, such as heating or cooling, through phase diagrams. Discover the significance of phase diagrams in different industries.

E N D
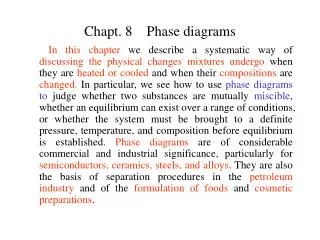
Chapt. 8 Phase diagrams In this chapter we describe a systematic way of discussingthe physical changes mixtures undergo when they are heated or cooled and when their compositions are changed. In particular, we see how to use phase diagramsto judge whether two substances are mutually miscible, whether an equilibrium can exist over a range of conditions, or whether the system must be brought to a definite pressure, temperature, and composition before equilibrium is established. Phase diagrams are of considerable commercial and industrial significance, particularly for semiconductors, ceramics, steels, and alloys. They are also the basis of separation procedures in the petroleum industry and of the formulation of foods and cosmetic preparations.
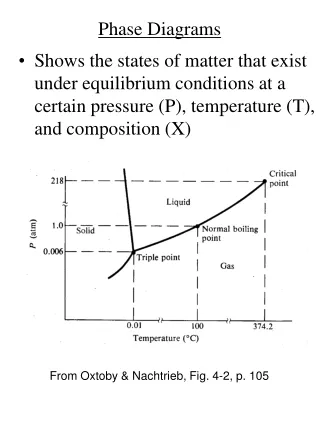
Phases, components, and degrees of freedom (described in chpt. 6) : The number of phases in a system is denoted P. 8.1 Definitions Phase A gas, or a gaseous mixture, is a single phase, a crystal is a single phase, and two totally miscible liquids form a single phase. A solution of sodium chloride in water is a single phase. Ice: (Single phase, P=1) Alloy: (Single phase, P=1) Ice is equilibrium with water: (Double phase, P=2)
Constituent:The number of chemical species (an ion or a molecule) presented in a system. Labeled as S. Component: A chemically independent constituent of a system. The number of components, C, in a system is the minimum number of independent species necessary to define the composition of all the phases present in the system.
Discussion: The relation between S and C (1) When no reaction takes place, the number of components is equal to the number of constituents. (Alcohol and water) (2) If there are reaction equilibriums exist, the number of components is equal to the difference between number of constituents and the number of equilibriums, R. That is C=S-R (8.1s) Example: HAc=H++Ac- in water If we above equilibrium does not consider, then S=2, R=0, C=2-0=2 If the equilibrium is considered, then S=4, R=1, C=4-1=3, which is different from above result. In fact, in above system, the concentration of H+ and Ac- is equal to each other, then a concentration condition should be considered, therefore, C=4-1-1=2 (3) If the concentrations of species are equal to each other, then the number of equal relations is labeled as R’, then C=S-R-R’ (8.2s)
Degrees of freedom The variance, F, of a system is the number of intensive variables that can be changed independently without disturbing the number of phases in equilibrium. Example: (a) Taking account of a system as: liquid water at 25oC and 1 bar. Here, S=1, C=1, the number of phase, P=1. It is clear the pressure and temperature may be changed independently without changing the number of phases, so F= 2. We say that such a system is bivariant, or that it has two degrees of freedom. (b) water at 100oC and 1 bar. Also, S=1, C=1, but P=2(liquid and gas). It is clear, if T is given, p is also given out, it can not change freely. Therefore, F=1.
8.2 The phase rule First we consider a one-component system(C=1). (1) One phase, P=1, F=2, T, p (2) Two phase, P=2, mJ(a,p,T)= mJ(b,p,T), which means a function between p and T exists. F=1, T or p. (3) Three phase, P=3, mJ(a,p,T)= mJ(b,p,T) andmJ(a,p,T)= mJ(g,p,T), F=0. It is clear thatthe maximum number of phase for a one-component system is three. Second for a two-component system(C=2). Except for T, p, x1, or x2 is another variable.
For an arbitrary components system, the number of variable occurred by composition is C-1. If there is P phase, then the total number of variable is P(C-1)+2 However, they are dependent to each other among P phases. For example, P=2 then Relation m1(a)= m1(b), m2(a)= m2(b),… mC(a)= mC(b), i.e., C1 P=3 m1(a)= m1(b), m1(a)= m1(g),… mC(a)= mC(g), i.e., C2 General speaking, there is C(P-1) relation, then we have F= P(C-1)+2-C(P-1) =C-P+2 (8.1) Above equation is phase rule.
Discussion: (1) To deduce phase rule, we assume the specie exists in all phase. In fact this assumption is unnecessary. (2) From phase rule, one can predict the max number of Phase and min number of Freedom Degree of a system. Because F= P(C-1)+2-C(P-1) =C-P+2 We understand that the minimum of F is Fmin=0, then the maximum number of P is Pmax=C+2 If C=1, then Pmax=3 which is same that described previously. On the other hand, Pmin=1, then Fmax=C+1. If C=1, then Fmax=2. (3) In eqn. 1, the number 2 is variable of T, p. If T or p is given, then we haveF’=C-P+1 or F’’=C-P. Both F*and F**are named as conditional freedom degree. (4) General formula for phase rule is F=C-P+n, where n is variables except for compositions.
F=C-P+2 (a) One-component systems Here C=1, (1) P=1, Then F=2 T, p variables. (2) P=2 Then F=1 T or p variable. (3) Pmax=3 Then Fmin=0 No variable.
(b) Experimental procedures To get the phase diagram, two techniques of thermal analysis, which takes advantage of the effect of the enthalpy change during a first-order transition, and differential scanning calorimetry are sused. In thermal analysis, a sample is allowed to cool and its temperature is monitored.
High pressure Modern work on phase transitions often deals with systems at very high pressures, and more sophisticated detection procedures must be adopted. Some of the highest pressures currently attainable are produced in a diamond-anvil cell like that illustrated in Fig. 8.5. The sample is placed in a minute cavity between two gemquality diamonds, and then pressure is exerted simply by turning the screw. The advance in design this represents is quite remarkable for, with a turn of the screw, pressures of up to about I Mbar can be reached which a few years ago could not be reached with equipment weighing tons.
Two-component systems C=2, then F=4-P. If T is given, then F’=3-P The Maximum value of F’ is 2. Here, the degree of freedom of T is discarded. Another degrees of freedoms are: p and x1 or x2. Therefore, the phase diagram is a map of pressures and compositions at which each phase is stable. On the other hand, if p is given, then a map of T versus x will be obtained.
8.3 Vapour pressure diagrams From eqn.3, xA=(p-pB*)/(pA*-pB*) Inserting above and eqn. 3 into eqn.5, then Ideal solution (a) The composition of the vapour pA=pA*xA, pB=pB*xB (8.2) The total pressure of the vapour is p=pA+pB= pA*xA + pB*xB = pB* + (pA* - pB*) xA (8.3) Then yA=pA/p, yB=pB/p (8.4) Inserting eqn. 2 and 3 into 4 The plot of eqn.3 and 5 listed at 199.
Discussion: According to eqn.5, If pA*>pB*, i.e., pB*/pA*<1, then for pA*>pB* for pA*<pB*
(b) The interpretation of the diagrams Overall composition: a, a2’’, a4 Phase composition: a1,a1’,a2,a2’, a3,a3’ In distillation, the compositions of liquid and vapour are equal interest.
Notes: • Points that lie between the two lines correspond to a system in which there are two phases present, one a liquid and the other a vapour. • (2) Among the area between black and blue line and at two lines, F’=1, therefore, if p is given, phase composition is given out, too. (3) If the pressure of the system is decreased, the state of the system will move down the vertical line because the overall composition doesn't change. The vertical line is called isopleth. (4) A line joining two points representing phases in equilibrium is called a tie line. (5) The exist of a phase no matter the amount of the phase itself.
(c) The lever rule n=na+nb (8.1s) where n is overall amount of the system included A and B. For A, nzA= naxA+ nbyA (8.2s) Inserting eqn.1s into 2s, we have (na+nb )zA= naxA+ nbyA (8.3s) Rearrange above formula, we have na(zA - xA)= nb(yA- zA) (8.4s) Then, na la = nb lb (8.7) Eqn.7 is the lever rule. As shown right, the state of the system moves from a to O by pressure descending. There are two phase, a and b, at this state. The amount of a and b are na and nb, respectively. It is clear that
na la = nb lb (8.7) Discussion: (1) Eqn. 7 can be used when a equilibrium between two phase exists. (2) At O1, la=0, from eqn. 7, nb should be zero, however, the b phase does exist, perhaps tiny. Similarly, at O2, a phase is tiny.
8.4 Temperature-com-position diagrams In previously description, we described the p~z diagram at given temperature. On the other hand, one can get the diagram of T~z. From the figure of p~z at different T, T~z figure can be obtained as shown right. In shadow, gas is in equilibrium with liquid.
(a) The distillation of mixtures Simple distillation:the vapour is withdrawn and condensed. This technique is used to separate a volatile liquid from a non-volatile solute or solid. Fractional distillation:Here, boiling and condensation cycle is repeated successively. This technique is used to separate volatile liquids. T, froma1 to a2. At a2, gas occurred. L-G coexisted. The vapour is richer in the more volatile component A (the component with the lower boiling point).
Theoretical plates Theoretical plates:The number of effective vaporization and condensation steps that are required to achieve a condensate of given composition from a given distillate. It is clear that if the composition of gas is similar that of the liquid, the theoretical plates is more to achieve the same degree of separation.
Real solution (1) Miscible liquids We discussed the diagrams of the ideal solution. For real solution, there are two cases. The first is two components are solved to each other during any compositions, and the second they are solved each other during some ranges of the compositions. Now we first discuss the first case, that is the two components are solved in whole concentration. (a) Slightly (mostly positive or negative) deviation (b) Large positive deviation As shown in figure, because the lowest boiling temperature for azeotrope, we call it as low-boiling azeotrope. Because the boiling temperature of azeotrope is determined, therefore the composition of azeotrope also has the only value at a given pressure. Example: H2O-C2H5OH, 351.28K, 95.57% at po. There is maximum vapour at the top of the curve. Corresponding, the boiling temperature has the lowest value. From the theoretical analyses, at this point, the composition of vapour is equal to that of liquid. Therefore, one cannot separates the material by simple distillation. We call the solution as azeotrope.
(c) Large negative deviation Here, a highest boiling temperature is observed. Similarly, the composition is constant at given pressure. The conditional degree of freedom is ZERO. Example:H2O-HCl, 381.65K, 20.24% at po. Note: (1) At right side, pure A and azeotrope can be obtained by distillation. However, at left side, only pure B and azeotrope can be obtained. (2) Azeotrope is considered as standard for titration. Please read the text at 325 in “Physical chemistry ” written by Nanjing Univ. (3) Most of systems, if A is negative, B also is negative.
(c) Immiscible liquids For immiscible liquids, at equilibrium, there is a tiny amount of A dissolved in B, and similarly a tiny amount of B dissolved in A: both liquids are saturated with the other component (see right Figure). The total pressure, p is p=pA*+pB*>pA* or pB* Therefore, the boiling temperature of mixture is lower than that of both A or B. This distinction is the basis of steam distillation,which enables some heat-sensitive, water-insoluble organic compounds to be distilled at a lower temperature than their normal boiling point.
8.5 Liquid-liquid phase diagrams (a) Phase separation As shown as right, two liquid is miscible at higher temperature. However, when the temperature decreases, for example, lower than Tuc, two phases are found. This system is named partially miscible. (b) Critical solution temperatures Point O is called critical point. The temperature at critical point is called the critical solution temperature. As shown as right figure, we call it as upper critical solution temperature, Tuc. If T>Tuc, in any ratio of A and B, two kinds of liquid solved to each other. Only single phase is observed. When T<Tuc, if the overall composition locates out side the cap, only single phase obtained. However, in the cap, there are two phases. Phase1 is the a saturated solution of A in B, and phase 2 the saturated solution of B in A. At a given temperature and pressure, the compositions of both saturated solution are determined. F’=2-2+1=1(T or z). If T is given, then F’’=0( error at 204). The amount of phase1 or phase2 can be calculated by lever rule.
Lower critical solution temperature As shown as right, some system has a lower critical solution temperature, which means that when T>Tlc, the mixture is composed of two phases among some ratio of A and B. However when T<Tlc, the two kinds of liquid are miscible. The next figure is an example of solid solution.
With both Tucand Tlc system The diagram is shown as right. Theoretical interpretation is described from the lelft figure.
(c) The distillation of partially miscible liquids Mole fraction of B,xB Mole fraction of B,xB
8.6 Liquid-solid phase diagrams Above figure is a typical liquid-solid phase diagram of two component. The mixture at c is called eutectic mixture. E is named eutectic point.
Box 8.1 Liquid crystals No required for you.
Box 8.2 Ultrapurity and controlled impurity To get materials of extreme purity for special uses, one usually uses zone refining illustrated as right.
(a) Eutectics (1) Point e is eutectic point. The temperature at e has the lowest value comparing both of melting point of both pure A and B. (2) The composition at e is called eutectic composition. (3) For any mixture, when it is cooled a platform is observed, which corresponding to the freeze of the eutectic mixture. (4) Solutions of composition to the right of e deposit B as they cool, and solutions to the left deposit A: only the eutectic mixture (apart from pure A or pure B) solidifies at a single definite temperature (F' = 0 when C = 2 and P = 3) with-out gradually unloading one or other of the components from the liquid.
(b) Reacting systems With an unstable compound. With a stable compound A typical diagram with a stable compound produced by the reaction of two compo-nents is shown as right. It looks like a combine of two simple diagrams.
The diagram of H2SO4 Following contents please reference the text book written by Nanjing university at 342-
Salt-H2O diagram This diagram is usually used for the purified of salt.
Combine of gas-liquid and liquid-solid diagrams for purifying the mixture
Other types of the diagrams Form solid solution through out any composition
8.7 The diagrams of tri-component Here C=3, Then F=C-P+2 The lowest value of P is 1,therefore Fmax=3-1+2=4 It is impossible to express the value by figure in four dimensions. For convenient one let both of T and p at a given value, then Fmax’’=3-1+0=2 The two variables are two of x1, x2 or x3. Now one can displays the diagram in two variables as before. However it is not convenient. One prefer to use triangle coordinate as shown next page.
(a) Triangle coordinate The composition at black point are: 30%A, 40%B, 30%C
(b) The properties of the triangle coordinate (1) At the side the concentration of the substance located against the side is zero. (2) The concentration of the substance at a top of the triangle is same when the system locates the line parallels with the side against the substance. The contents of B at 1, 2, and 3 are: 50%
(3) As shown the next figure, if we connect the point 1 with the vertex A, then ratio of B and C is same at this connect line. The ratio of B and C is same for 1, 2 and 3, but the A increases from 1 to 3.
(4) There are two tricomponents systems as shown in next figure, D and E. The mixture of these two systems locate at the connection of D and E. The position of the new system can be calculated by lever ruler. WDOD=WEOE W=WD+WE O closed to E if WE>WD
Justifications For C, it is clear that: WO,C=WD,C+WE,C WO,C=Woad WD,C=WDab WE,C=WEaf Then Woad= WDab+WEaf WO=WD+WE (WD+WE)ad = WDab+WEaf WD(ad-ab)=WE(af-ad) i.e. WDbd=Wedf then WDDO=WeOE
(5) Application In a special case, if one system is mixture, S, another is PURE substance, for example, A. Then when A is added into S gradually, the new system will run along with the connection of SA and close to A which as shown left figure. In contrast, If A is take our, for example, evaporate, occur crystal, and so on, then the residue will locate the extend of the connection of AS and run far from the A, as shown as right.
The diagram for tri-component 1. Partially miscible of pair of liquids In the figure, out the cap is single phase, F’’=3-1=2 in the cap, two phase coexist, for example, a1,b1, a2, b2, …, where a1,b1, or a2,b2 are conjugatingsolution,respectively. Normally, the connection line between two conjugating solution is not parallel with the bottom line of triangle. The cap line is called bi-nodal curve. And O is called isothermal consolute point or plait point.