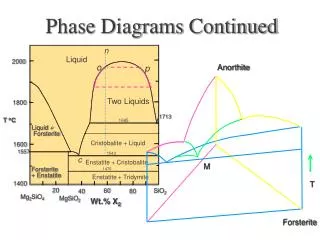
Phase Diagrams
330 likes | 464 Views
Exploring the equilibrium states of matter under specific pressure, temperature, and composition conditions. Learn about phase transitions, solid solutions, ideal and regular solutions, and the lever rule. Discover how to interpret phase diagrams and calculate Gibbs free energy.

Phase Diagrams
E N D
Presentation Transcript
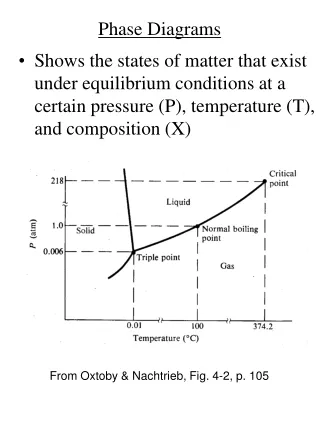
Phase Diagrams • Shows the states of matter that exist under equilibrium conditions at a certain pressure (P), temperature (T), and composition (X) From Oxtoby & Nachtrieb, Fig. 4-2, p. 105
Phase Diagrams • States of matter : • Solid • Liquid • Gas • Different crystalline forms • e.g., Ga has orthorhombic crystal structure (g) • As has rhombohedral crystal structure (a) • Ga0.5As0.5 has zincblende crystal structure (c)
Phase Diagrams • The lines in a phase diagram indicate an equilibrium (coexistence) between two phases (DG = 0) • XS ↔ XL (solid-liquid equilibrium) • ↔ b (crystal structure transformations) From Oxtoby & Nachtrieb, Fig. 4-2, p. 105
Two-Component Phase Diagrams • One-component phase diagram is a 2-D plot of T (x-axis) versus P (y-axis) • For two components, phase diagram is a 3-D plot of T, P, and X; usually plot X (x-axis) versus T (y-axis) with P fixed • Caution: P for phase diagrams is usually fixed at 1 atm (STP); but MBE occurs a lower pressures • (< 10-3 Torr)
Alloy Solutions • e.g., SixGe1-x • In1-xGaxAs From Porter & Easterling, Fig. 1.7, p. 12 • G = xAGA + xBGB + DGmix
Alloy Solutions • G = xAGA + xBGB + DGmix DGmix = DHmix – TDSmix Three types of solid solutions: Perfect Ideal Regular DHmix = 0 DSmix = 0 DHmix = 0 DSmix > 0 DHmix > 0 DSmix > 0
Perfect Solutions • G = xAGA + xBGB • DHmix = 0 • DSmix = 0 • e.g., a gas mixture where atoms do not interact (ideal gas) From Porter & Easterling, Fig. 1.8, p. 13
Ideal Solutions • Atoms are chemically similar and occupy similar lattice sites, e.g., SixGe1-x (DHmix ~ 0) • Boltzmann equation: DSmix = R ln w (configurational entropy) • w = # distinguishable ways of arranging atoms in the solution From Porter & Easterling, Fig. 1.7, p. 12
Ideal Solutions • w = (NA + NB)! / NA! NB! • DSmix = R ln w • = - R (XAlnXA + XBlnXB) • XA, XB < 1 therefore DSmix > 0
Ideal Solutions • G = xAGA + xBGB + DGmix • = xAGA + xBGB+ RT (XAlnXA + XBlnXB) From Porter & Easterling, Fig. 1.12, p. 15
Ideal Solutions • The state with the lowest G will be the stable phase From Porter & Easterling, Fig. 1.29, p. 34
Total Gibbs Free Energy G GS GL GL+S A Xo XS XL B • Two phases with composition XS and XL have a total G given by GL+S • Two phases (L+S) with composition XS and XL have lower G than either phase alone Reference: D.A. Porter and K.E. Easterling, “Phase Transformation in Metals and Alloys” (Chapman & Hall, 2nd edition, 1992)
Common Tangent Construction G GS GL GL+S A XL B XS Xo • The lowest G is achieved by separating into L + S with compositions defined by the tangent points on the curves GS and GL
Lever Rule • The lever rule indicates the relative phase amounts: • % Liquid = (XS – Xo) / (XS – XL) x 100 • % Solid = (Xo – XL) / (XS – XL) x 100 G GS GL GL+S A XL B XS Xo
Ideal Solutions • The state with the lowest G will be the stable phase From Porter & Easterling, Fig. 1.29, p. 34
Liquid Phase Epitaxy (LPE) • If a liquid with composition Xo is lowered in temperature from A to B then liquid will form with composition XL and solid with composition XS A B From Ohring, Fig. 1-12, p. 28
Lever Rule • The lever rule indicates the relative phase amounts that are formed: • % Liquid = (XS – Xo) / (XS – XL) x 100 • % Solid = (Xo – XL) / (XS – XL) x 100 A B From Ohring, Fig. 1-12, p. 28
Ideal Solutions • Phase diagrams for SixGe1-x at typical MBE conditions From Tsao, Fig. 3.4, p. 60
MBE Growth • If a vapor with composition Xo is lowered in temperature from A to B then crystal will form with composition Xc and vapor with composition Xv A B Ge Xo Si Xc Xv X From Tsao, Fig. 3.4, p. 60
Lever Rule • The lever rule indicates the relative phase amounts: • % V = (Xc – Xo) / (Xc – Xv) x 100 • % C = (Xo – Xv) / (Xc – Xv) x 100 A B Ge Xo Si Xc Xv X From Tsao, Fig. 3.4, p. 60
Regular Solutions Three types of solid solutions: Perfect Ideal Regular DHmix = 0 DSmix = 0 DHmix = 0 DSmix > 0 DHmix > 0 DSmix > 0
Regular Solutionse.g., Stoichiometric Compounds • e.g., Ga + As GaAs • Ga has orthorhombic crystal structure (g) • As has rhombohedral crystal structure (a) • Ga0.5As0.5 has zincblende crystal structure (c) • 7 phases: solid Ga, solid As, solid GaAs, liquid As, liquid Ga, vapor Ga, vapor As2
Stoichiometric Compounds Regular Solutions: DHmix > 0 From Tsao, Fig. 3.8, p. 73
MBE Window • MBE window is indicated by shaded region As Ga xc From Tsao, Fig. 3.8, p. 73
MBE window is bounded on the left by Ga-rich liquid plus GaAs compound 2-phase region • Need As-rich vapor to prevent liquid Ga formation (xo > 0.5) MBE Window From Tsao, Fig. 3.8, p. 73 A B As Ga xv xc xo
MBE Window • MBE window is bounded on the bottom by a GaAs compound plus As-rich crystal 2-phase region • Need Tsubstrate > 600 K A B As Ga xv xc xo From Tsao, Fig. 3.8, p. 73
MBE Window • Otherwise, excess As condenses into rhombohedral crystal structure, <As>a • Low-temperature MBE From Tsao, Fig. 3.10, p. 76
MBE Window • MBE window is bounded on the top by Ga-rich liquid plus As-rich vapor 2-phase region • Need Tsubstrate < 1000 K A B As Ga xv xc xo From Tsao, Fig. 3.8, p. 73
MBE Window • Otherwise GaAs will decompose into Ga liquid and As2 vapor From Tsao, Fig. 3.9, p. 75
Binary AlloysRegular Solutions G = xAGA + xBGB + DGmix DGmix = DHmix –TDSmix From Porter & Easterling, Fig. 1.15(c) & (d), p. 20
Binary Alloys • e.g., mixture of InAs and GaAs to form In1-xGaxAs • lattice constants: aInAs = 6.0584 Å, aGaAs = 5.6533 Å • DHmix > 0 due to the bond bending and stretching from equilibrium positions • Randomly mixed solution is thermodynamically unstable • InAs and GaAs bonds are preferred compared to average InGaAs bonds • G is lowered by phase separating into InAs-rich and GaAs-rich regions From Porter & Easterling, Fig. 1.18(a) & (b), p. 23
Phase Separation LaPierre, Ph.D. thesis
Miscibility Gap • Spinodal isotherms for III-V alloys From Panish & Temkin, Fig. 2.12, p. 31