Download
1 / 29
300 likes | 438 Views
Monitoring & Evaluation for Routine Immunization: Data For Action. Using information to improve routine immunization services. Presentation 2 Objectives. Be familiar with the role of information in routine immunization

E N D
Monitoring & Evaluation for Routine Immunization: Data For Action Using information to improve routine immunization services
Presentation 2 Objectives • Be familiar with the role of information in routine immunization • Be able to use, modify or develop tools for monitoring or improving data quality and use at health facility / district level • Be aware of resources available for vaccination information in routine immunization
Overview of M&E framework for RI Goals * WHO / UNICEF Global Immunization Vision and Strategy ** Millennium Development Goal 4
How monitoring works for RI • RI staff at all levels routinely monitor system performance and use this information to drive decision-making • Monitoring indicators include • Doses administered, coverage, dropout • Monitoring tools include • Monitoring charts, tables, monthly summary forms • Internal monitoring activities include • Supervision visits • Rapid community assessments
How evaluation works for RI • Internal evaluation activities include • Annual reporting of ~40 EPI indicators to WHO/UNICEF including doses administered and immunization coverage • Data quality self-assessments • Lot quality assurance surveys • External evaluation activities include • External immunization coverage surveys • Data quality audits
How Data for Action works for EPI • RI staff are expected to monitor their system AND use this information for action • Use of RI information to improve coverage is often the weakest part of RI • Supervisors (& you) should observe and ask staff if they know how to both calculate and use monitoring indicators, tools and activities
Common RI Indicators • Service performance • Defined as number of children receiving one of the later vaccines • Coverage with DTP3 (DTP = DPT = DTC) • Coverage with measles • Percentage of children never reached • Access • Defined as availability/start of services (number of children who received one of the earliest vaccines) • Coverage with BCG or DTP1 • Utilization • Defined as continued use of services • “Dropout rate” e.g. the number of children who received an early vaccination (DTP1) compared to the number of children who received a later vaccination (DTP3)
How to calculate coverage • Coverage formula ________number of doses given_______ X 100 estimated number of age-eligible children in catchment area • Sources of error for coverage • Number of doses given • Estimated number of age-eligible children in the catchment area
How to calculate dropout Dropout definition: Child begins but does not complete immunization schedule Drop-out rate formula [ ( # Beginning – # Ending ) / # Beginning ] X 100 • Usually, series begins with DTP1 or BCG and ends with DTP3 or measles = [( DTP1 – measles ) / DTP1] X 100 = [( DTP1 – DTP3 ) / DTP1] X 100 = [( BCG – measles ) / BCG] X 100 = [( BCG – DTP3 ) / BCG] X 100
Visualization of Never-reached versus Drop-outs Never-reached Never-reached Drop-outs Drop-outs
Tool 1: Monitoring chart • Used at multiple levels to visually track monthly performance • Charts include: • Number of doses administered per month • Cumulative number of doses administered in year • Coverage rate • Difference in number of doses administered between 2 vaccines (dropout) • Monthly target and cumulative target population • Good charts are: • Up to date • Properly filled
Completing an Immunization Monitoring Chart • Enter monthly objectives on the y-axis (target population ÷ 12) • Diagonal line represents regular progress over a 12 month period ending with 100% coverage • Every month • Enter the antigen total for the month • Calculate the cumulative total for the antigen • Mark the cumulative total on the chart with a dot • Calculate the cumulative number of drop outs • Calculate the cumulative drop out rate
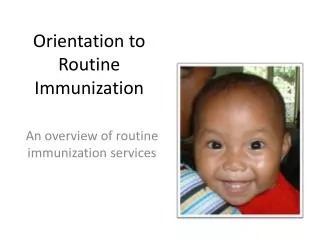
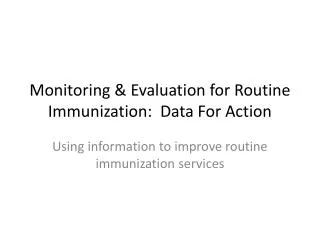
Practice: How to fill in a monitoring chart • Zorgho, 2003 • Target population < 1 = 12,897
Zorgho 2003 12897 1075 12897 11822 10748 9673 8598 7523 6449 5374 4299 3224 2150 1075 0
Zorgho 2003 12897 1075 12897 11822 10748 9673 8598 7523 6449 5374 4299 3224 2150 1075 0 836 836 909 1745 818 2563 525 525 631 1156 539 1695
Zorgho 2003 12897 11822 10748 9673 8598 7523 6449 5374 4299 3224 DTP1 2150 1075 DTP3 0 836 836 909 1745 818 2563 525 525 631 1156 539 1695 311 589 868 37 34 34
Tool: Immunization summary form • Facility summary form • Summary of doses administered at facility • Data summarized from session tally sheets • District summary form • Summary of doses administered across all facilities in district • Data summarized from facility summary sheets • Sent monthly by each level • Used nationally as source of information on number of doses administered
Illustrative flow of immunization summary information National Department of Epidemiology EPI program Consolidated monthly Surveillance report Weekly reports Consolidated monthly reports, vaccination Case reports District Monthly reports Case reports Weekly reports Health Center consolidates Tally sheets Patient registers Case reports Health Center Health posts Outreach sites
Tool: Defaulter Tracking System • Method to identify children who did not return for vaccination (drop outs) • Multiple tools used as “tracking system” • Ledger of children’s names who dropped out • Tickler box or blanket • Copy of vaccination card is kept with the month when child is expected to return • At end of month, remaining cards used to identify and then find children who did not return
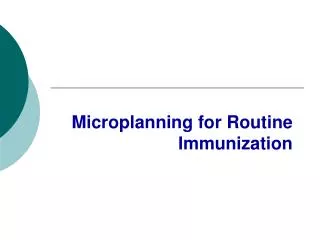
Tool: Prioritize your locations by severity of problems (I) What proportion of the children have ACCESS to immunization services? (what is DTP1 coverage?) HIGH coverage with DTP1 (>80%) Low coverage with DTP1 (<80%) What proportion of children COMPLETE the immunization schedule (what are the DTP1 - DTP3 drop-out rates?) Drop-out rate <10% Drop-out rate >10% Drop-out rate <10% Drop-out rate >10% Categorize the problem • Dropout rates are low = good utilization • Coverage is high = good access • Category 1 (no problem) • Dropout rates are high = poor utilization • Coverage is low= poor access • Problem Category 4 • Dropout rates are high= poor utilization • Coverage is high = good access • Problem Category 2 • Dropout rates are low = good utilization • Coverage is low= good access • Problem Category 3 Source: Increasing immunization coverage at the health facility level, WHO 2001
Tool: Prioritize your locations by severity of problems (II)
Tool: Rapid community assessment • Monitoring tool used by supervisors to rapidly understand whether vaccination services are reaching the community and identify barriers to vaccination • Not a survey and does not generate coverage rates • Useful to use in places where administrative vaccination coverage is reportedly high • A rapid assessment should not find many unvaccinated children • General method • Select ~20 households and assess vaccination status and reasons for no vaccination • Should be conducted in parts of a catchment area where low coverage is expected
Thanks Questions?