Download
1 / 22
220 likes | 336 Views
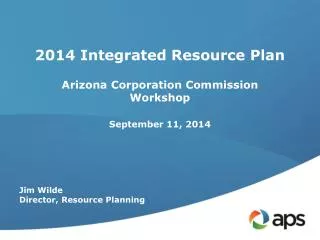
2014 Integrated Resource Plan Arizona Corporation Commission Workshop September 11, 2014. Jim Wilde Director, Resource Planning. 2014 IRP Supplement.

E N D
2014 Integrated Resource PlanArizona Corporation CommissionWorkshopSeptember 11, 2014 Jim Wilde Director, Resource Planning
2014 IRPSupplement • Modify chosen portfolio from the Selected Portfolio (April 2014 Selected Portfolio) to the Coal Reduction Portfolio (September 2014 Selected Portfolio) • Currently in talks with EPA, ADEQ and PacifiCorp to craft a resolution for Cholla: • Retire Unit 2 in 2016 • Retire Units 1 and 3 in mid-2020’s (at end of coal contract) or convert to natural gas • Modification based on economics of required environmental upgrades to comply with MATS and Regional Haze • Similar to Four Corners 1-2-3, environmental upgrades cannot be supported given lack of economies of scale • Portfolio modification will produce cost savings to customers and reduce environmental impacts • IRP Supplement will be filed with the ACC 2
2014 IRP Summary 2014 • Natural gas generation will play increasingly important role • Economics • Operational flexibility • Cleaner energy mix • Customer resources such as roof-top solar and energy efficiency projected to triple • Environmental regulations • Advanced technology will change the electricity grid • Integration of renewable energy • Communication and automation 2029 3
Supply-Demand Gap • Growth in customer energy requirements expected to resume • Customer resources expected to triple over planning horizon • Expiring purchase contracts means APS will need additional resources by 2017 • Additional resource needs anticipated to be met by increasingly diverse and efficient technologies New CustomerResources Demand Requirements Existing Contracts New Utility-Scale Resources Existing Resources 4
Expected Future Resources Sept 2014 Selected Portfolio 2014-2029(Forecast) Future AdditionalResources 7,267 MW Expected at Peak a. New Utility-Scale Resources • Natural Gas • 4,817 MW • Renewable Energy • 467 MW (1,018 MW nameplate capacity) • New Customer Resources • Energy Efficiency • 1,447 MW • Distributed Energy • 261 MW (722 MW nameplate capacity) • Demand Response • 275 MW a b 2014 • 8,124 MW • peak requirement • 100% metwith existing resources 2029 12,982 MW peak requirement 45% met with existing resources Existing Utility-Scale Resources Existing Contracts Existing Customer Resources a New Utility-Scale Resources b New Customer Resources 5
Portfolios Considered2029 Capacity Comparison • Sept 2014 Selected Portfolio is being chosen because it provides better combination of: • Overall cost • Operational flexibility to support grid reliability and renewable energy integration • Provides for discussion of uncertainties in upcoming coal fleet decisions 14,111 Coal Nuclear Energy Efficiency & Demand Response Renewable Energy (nameplate) Natural Gas * Coal Reduction Portfolio 6
Energy Mix2014 vs 2029 Comparison • Of the four portfolios considered, all have a diverse resource mix • Renewables and coal primary resources being flexed in portfolio analysis • Natural gas resources used to balance out remaining needs by providing summer capacity and operational flexibility Coal Nuclear Energy Efficiency & Demand Response Renewable Energy Natural Gas * Coal Reduction Portfolio 7
Comparative Revenue Requirements Differences from Apr 2014 Selected Portfolio in 2029 +$634 MM +$29 MM Apr 2014 Selected Portfolio - $106 MM Sept 2014 Selected Portfolio* Enhanced Renewable Portfolio Coal-to-Gas Conversion Portfolio * Coal Reduction Portfolio 8
Evolving Customer Demand • Growth of solar PV changes customer energy consumption patterns • Generators must be able to start and stop multiple times per day • Fast starting and ramping capability is required in responding to intermittent output of renewable resources 9
Variability Requires FlexibilityBalancing Growth at Both Ends of Flexibility Spectrum CC CT DE EE Coal Nuclear Geothermal Biogas Biomass DR & Options Solar PV Wind Capacity (MW) CSP with storage Gas Steam + Storage 0 - Flexible Variable/Inflexible Less Flexible Semi-flexible 10
Future Technology DriversTransition Towards Integrating Evolving Energy Resource Portfolio • System Drivers • Increasing amounts of intermittent generation • Need for peaking resources and summer time capacity • Cost of compliance with environmental regulations • Stable natural gas prices • Potential Benefits • Increased resource diversity • Flexible gas generation meets peak needs and enables renewable energy integration • Reduced environmental impacts • Potential Risks • Cost of resource diversity for newer technologies • Technology maturity and uncertain reliability • Maintaining balance between variable/inflexible resources and flexible resources Potential value of storage 11
Sample of Potential Future Energy Storage Options • Battery Storage • Uses off-peak/dump energy from grid to charge battery • Discharges energy when needed • Flywheel/Rotary Uninterruptible Power Supplies (UPS) • Very short-term energy and voltage stabilization • Pumped Hydro • During periods of high demand, power is generated by releasing water from an upper reservoir through turbines in the same manner as a conventional hydropower station • During periods of low demand, the upper reservoir is recharged by using lower-cost electricity from the grid to pump water from a lower reservoir back to the upper reservoir • Compressed Air Energy Storage (CAES) • CAES potential in helping provide back up for solar and wind generation • Geologic and permitting concerns 12
Solana – Energy Storage Today • Developer - Abengoa • Location – 10 miles west of Gila Bend, AZ • Capacity/Generation – 250 MW, annual energy approximately 900,000 MWhs • In-Service – October, 2013 • Thermal energy storage • Six hours at full capacity • Increased hours of storage at lower capacity levels • 100% solar power availability at time of peak • Solar PV has reduced levels of capacity at time of peak • Operational flexibility • Start before sunrise and run for morning peak by holding energy in storage from previous day • Continue to run for evening peak (after sunset) 13
Battery Storage vs Equivalent CT Costs • Primary technologies • Sodium Sulfur (NaS) • 15 year battery life, 6 hour capability • Sodium Nickel Chloride (NaNiCl) • 15 year battery life, 5 hour capability • Lithium Ion (Li-Ion) • 15 year battery life, 5 hour capability • Not a viable capacity solution at this time • High costs relative to other options • Value will increase as reliability is proven and costs come down • Limited number of utility scale sites • Will be evaluated in future IRPs • Significant resource needs for 2019 and beyond • Near term opportunities for pilot projects $ Millions/year Source: DOE/EPRI 2013 Electricity Storage Handbook 14
Ocotillo Modernization Project • Retire aging, large steam units constructed in 1960 • Replace steam units with modern technology • Maintain Valley reliability • Responsive unit operations • Environmental attributes • In-service planned for summer 2018 15
Proliferation of Distributed Generation Demands A More Advanced Grid Fiber Backhaul Substation Health Monitoring Demand Response TOAN TOAN Integrated Volt/VAR Control Fault Indicators Automated Switches AMI ADMS EMS Transformer Load Management AMI Solar Production Meters 16
APPENDIX 18
Incremental Near-Term Natural Gas Resource Needs • Of the 3,800 MW needed by 2021, the 2014 IRP calls for 2,400 MW to come from natural gas resources • Capacity from Ocotillo Project represents roughly 20% of near term natural gas resource needs, and roughly 13% of total need • Significant reliance on markets 19
Potential Future Resource Technologies • Nuclear (SMR) • Small modular reactors (SMR) will be nuclear technology of choice after 2025 (EIA) • Typically smaller than 300 MW • Built off-site in a modular arrangement, shipped to plant, and set up on plant foundation • Coal • Ultra-supercritical steam turbines (USC) are an early commercial technology • Integrated gasification combined cycle (IGCC) integrate coal gasification with combined-cycle technology • Solar Tower Systems • Field array of mirrors reflect sunlight onto a central receiver located at top of tower • Could be competitive with parabolic trough with thermal energy storage, if proven reliable & cost-effective • Fuel Cells • Types include alkali (AFC), phosphoric acid (PAFC), molten carbonate (MCFC), proton exchange membrane (PEM), solid oxide fuel cell (SOFC), and direct carbon (DCFC) • Unsuitable for distributed generation or smart-grid applications until reliability improves, costs are reduced, and cell-stack life is extended • Natural Gas (CC & CT) • Clean burning • Efficient • Simple cycle combustion turbines (CT) have quick start & fast ramping capability • Customer-Side Resources • Energy Efficiency (EE) • Distributed Generation (DG) 21
Planning Considerations Load Forecast Regulation Existing Resources Stakeholders 2014 IRP Customer Resources Cost Reliability and Safety Environmental Impact Future Resource Options 22