Download
1 / 16
160 likes | 185 Views
Learn about Years of Potential Life Lost and Disability-Adjusted Life Years, key measures in assessing the burden of disease. Explore age, period, and cohort effects, and how to detect cohort effects in disease trends.

E N D
OTHER MEASURES OF MORTALITY AGE-COHORT ANALYSIS Nigel Paneth
Two Other Measures Of Burden Of Illness/mortality Less Widely Used 1. YEARS OF POTENTIAL LIFE LOST (YPLL) 2. DISABILITY-ADJUSTED LIFE YEARS (DALYS)
Years Of Potential Life Lost (YPLL) • The number of deaths due to a cause of disease multiplied by the difference in years between age at death and a certain target age. • Target age can be 65, 70, mean age at death in the population, or any other age you choose.
Years Of Potential Life Lost (YPLL) For example, If the target age is 70, then: 100 deaths at age 60 = 1,000 YPLL 50 deaths at age 40 = 1,000 YPLL 20 deaths at age 20 = 1,000 YPLL
Disability-adjusted Life Years (DALYS) This adds a measure of disability to YPLL. If we know the incidence of disabilities, and can score their severity, we can roughly quantify the amount of years lost, not just to death, but to disabling conditions as well. WHO refers to DALYs as measuring the Global Burden of Disease (GBD).
DALY’S FROM COMMUNICABLE DISEASES IN DIFFERENT PARTS OF THE WORLD INDIA CHINA USA/WESTERN EUROPE Tuberculosis 4% 3% 0.2% Diarrhea 10% 2% 0.3% Respiratory Infections 11% 6% 2.6% Total Communicable 50% 25% 10%
DALY’S FROM OTHER DISEASES IN DIFFERENT PARTS OF THE WORLD INDIA CHINA USA/WESTERN EUROPE Cancer 4% 9% 19.0% Perinatal Causes 9% 5% 2.2% Injuries 9% 17% 12.0% .. TOTAL DALY’S PER 1,000 344 178 94 POPULATION
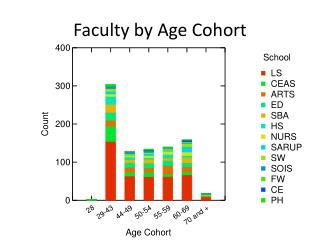
AGE EFFECTS AGE EFFECTS Patterns of disease frequency which are due to the aging of the population. Example: Rates of coronary artery disease by age.
PERIOD EFFECTS Patterns of disease frequency which are due to the period of time in which the people live. Example: Elevated death rates from pneumonia and influenza in the winter
COHORT EFFECTS Patterns of disease frequency due to an exposure occurring to a group of people at about the same time in their lives (and who are therefore of the same age, and, who, as they age, represent a cohort) Examples: • Birth cohort - all people born in 1900 • Veteran cohort - all men (of similar ages)who served in the military together • Employment cohort - all individuals (of similar ages) hired by a company at about the same time
DETECTING COHORT EFFECTS • Cohort effects are a special interaction of age and period. • The three effects are interrelated. Once two are specified the third is determined by the other two • Cohort effects are often hard to detect because analysis is usually by age and period. • Cohort effects are usually seen as an elevated risk which changes with age over time
DISEASES WITH COHORT EFFECTS Many important disease time-trends can better be understood by cohort analysis. This includes: Peptic ulcer tuberculosis congenital rubella prostate cancer (possibly)
DEAF-MUTES IN NEW SOUTH WALES, AUSTRALIA AGE191119211933 0-4 16 17 11 5-9 59 72 95 10-14 111 86 89 15-19 64 57 141 20-24 65 117 98 25-29 60 59 69 30-34 54 67 140 35-39 57 62 71 Do you see the birth cohort effect in these data?
The data show a peak in deaf-mutes among 10-14 years olds in 1911, among 20-24 year olds in 1921, and among 30-34 year olds in 1933. This is clearly the same cohort that is aging. Later research showed that a rubella epidemic took place in New South Wales at the same time that this cohort was in utero. The effects of congenital rubella infection in causing sensori-neural hearing loss were not discovered until decades later, but these data were early evidence of the effects of the epidemic.