Download
1 / 24
240 likes | 341 Views
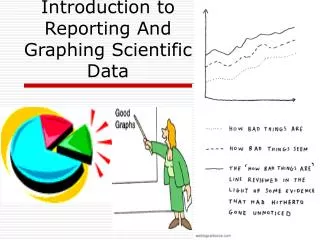
Introduction to Reporting And Graphing Scientific Data. 1) What are variables?. Anything that can change or vary in a science experiment. 2) Studies , grades 3) Times , training 4) mass , damage. 5) INDEPENDENT Variables (IV). 6) DEPENDENT Variables (DV)

E N D
1) What are variables? Anything that can change or vary in a science experiment. 2) Studies, grades 3) Times, training 4) mass, damage
5) INDEPENDENT Variables (IV) 6) DEPENDENT Variables (DV) #2 Studies (IV), grades(DV) #3 Times(DV), training(IV) #4 mass(IV), damage(DV) 7) do NOT have a relationship.
8) Controlled 9) #2 attitude, environment, distraction #3 weather, shoes, track #4 how fast, surface area, seatbelt
10) The experimental control is a standard of comparison. It used in scientific experiments to prevent factors other than those being studied from affecting the outcome.
Experiment 1: Graphing • Y-axis • Y-axis • Dependent variable (DV) • Dependent variable (DV) • Independent variable (IV) • Independent variable (IV) • X-axis 8. X-axis
9) Scientific data (points) 10) Line of best fit (best-fit-line) 11) Display the relationship between the independent and dependent variable. Or show the trend in the data
Data Tables a) IV b)DV Complete example 1
Graphing Data page 5 • ½; 1 line = spread of values number of lines • NOT; DO • 5th • Zero, zero • Example #1 graph the following data on the graph on page 6/5.
DV IV
LINE of BEST FIT (LOBF) • Do NOT connect the dots! • Place your CPROS on the first & the last data points. • Determine if the LOBF is straight or curved. • There should be the same number of data points above or below the line. • Some points might be on the line but rarely will all of the points be on a LOBF. • Lets practice complete page 7
Calculating Slope pg 8 1. What is slope? • Position in miles • Time in hours • Constant speed 2. Slope =rise/run 1) 10/5 = 2 2) yes, because the 5/2.5 =2
3. Calculating slope using the equation. • Slope = y2 -y1 / x2 -x1 so 50-20 / 2-0 = 30/2 = 15 • y-intercept = 20 • y = 15x + 20 • y = $15(3 hrs) + $20 = $65 • YES, the students can earn $620 ( 5hrs x 8 days =40 hrs)
4. Practice calculating the slope • 60- 0 / 6-0 = 10 • y-intercept = 0 • y= 10x
Interpreting Graphs pg12 What is the title? 1. Car Washing Moolah 2. IV – hours of washing & DV amount of money What are the steps for making your own graphs?
5) Dollars 6) Data not spread out 7) YES 8) Direct relationship 9) $75 x 5 hr X 3 days =1125
Steps for a Line of Best Fit graph (LOBF). Page 5 • Identify your IV & DV. • Determine range for data. • Scale each axis according to the range. • Label each axis with name and unit. • Plot data points. • Draw LOBF for the data. • Title your graph
Interpreting a Bar Graph • Teen Workers • Cities, boys & girls employed • % vary from city to city • % of boys to girls employeed are different • ANY • ANY
Interpreting a Pie Graph • Teenagers Job • Types & % of jobs held by teens. • No • Retail hires more teens, service/other hires the least, etc. • Answers will vary • Answers will vary
Lab Report Format • Purpose/Problem Why are we doing the lab? What questions are you trying to answer? This includes an independent and a dependent variable
Hypothesis What do you expect the results to be? This should relate directly to the problem This includes an independent and a dependent variable
Materials List of all the Materials you will use during the lab Background Information Usually provided by the teacher Information that is necessary to make an educated guessProcedure Steps should be listed and numbered Steps should be clearly written, detailed, and brief It must indicate HOW data will be taken This should include a control group & an experimental group Be sure this is controlledThis should answer the question posed in the purpose/problem.
Data Must be in the form of a table or a sketch (determined by the procedure) Be sure to label sketches and/or use units Data should match the data collection outlined in the procedureAnalysis A graph may be needed What type of graph? Use a line graph if the data is not continuous (example the height of individual trees)Use a bar graph is the data is related(growth of a single tree over a period of time)Conclusion A good conclusion answers 3 questions: What did you do in the lab? Restate the purpose/problem A brief description of how you tested it What you used to gather data What does your data say?Look at your data table or sketch and turn it into a sentence or two. Be sure to include both the control & experimental groups. What did you learn?