Graphing and Analyzing Scientific Data
Graphing and Analyzing Scientific Data. Write the following heading in your notebook and answer the bell work question. “ Graphing and Analyzing Scientific Data” 8/26/2015 Homework: Graphing and Analyzing Scientific Data Worksheet (if not finished during class)

Graphing and Analyzing Scientific Data
E N D
Presentation Transcript
Graphing and Analyzing Scientific Data • Write the following heading in your notebook and answer the bell work question. • “Graphing and Analyzing Scientific Data” 8/26/2015 Homework: Graphing and Analyzing Scientific Data Worksheet(if not finished during class) BW: Sketch an example of a line graph, bar graph, and pie graph.
Objectives • I will learn about different ways to graphically represent data. I will also learn how to analyze these graphs for scientific data. • I will show that I can graphically represent data by constructing my own graphs and using these graphs to analyze a set of given data.
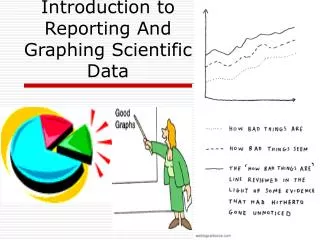
Types of Graphs • Pie/Circle Graphs • Used to show parts of a whole. • Bar Graphs • Used to compare amounts • Line Graphs • Used to show the change of one piece of information as it relates to another change.
Parts of a Graph • Title • Summarizes information bing represented in ANY graph. • Independent Variable • Variable controlled by the experimenter. Placed on X axis. • Dependent Variable • Variable directly affected by independent variable. Placed on Y axis. • Scales • Tells you where to plot data points. • Legend • Describes the graph’s data.
Variables • any item, factor, or condition that can be controlled or changed • looking for a cause and effect relationship
So then… • x is the … • y is the… • m and b are… • Together they show a… • Independent variable • Dependent variable • Constants • Relationship
y=mx+b • Are there any restrictions on what x can be? • What determines the value of y? • What happens when I plug x into that equation? • Do m and b change? • What is the result if I plug several values for x into that equation?
Mean, Median, Mode • Mean • Determined by adding all the numbers in a data set together and then dividing by the number of values. • EX: 2 + 4 + 6 = 12/3 = 4 • Median • Middle number in a set of data. If there is an even set of numbers in the data, then take the average of the two middle numbers. • EX: 2, 3, 4, 8, 12, 16, 20 median = 8 • EX: 3, 5, 8, 11, 17, 19, 27, 30 median is 11 + 17 = 28/2 • Mode • The number that occurs most often in a data set. • EX: 3, 4, 6, 6, 7, 9, 9, 9, 12, 12, 15 mode = 9
Interpreting data • Extrapolate: extending the graph, along the same slope, above or below measured data. What would you expect pay for 30 Kg?
Interpreting data • Interpolate: predicting data between two measured points on the graph