Engineering Tables and Graphics
Engineering Tables and Graphics. Tables Charts: Pie charts Column charts Bar charts Graphs Illustrations: Photographic illustrations Line drawings Schematics Info-graphics. Tables. Convert repeating text to tables. Use tables for two-column lists.

Engineering Tables and Graphics
E N D
Presentation Transcript
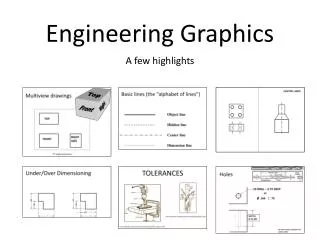
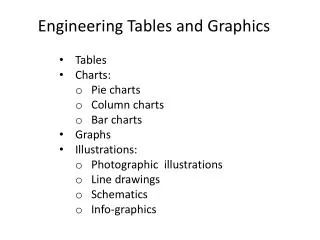
Engineering Tables and Graphics • Tables • Charts: • Pie charts • Column charts • Bar charts • Graphs • Illustrations: • Photographic illustrations • Line drawings • Schematics • Info-graphics
Tables • Convert repeating text to tables. • Use tables for two-column lists. • Import spreadsheet data to tables. • Search for repeating information in paragraph format to convert to tables. • Cite sources of table data • Use descriptive table title (at top)
Table Format • Left-align textual or mixed (numeric and textual) data in columns. • Right-align numeric data in columns. • Decimal-align currency and similar data in columns. • Indicate measurement type in column or frow headings • Prefer vertical arrangement for easier comparison. • Use column headings to characterize content of columns only. • Use row headings to characterize content of rows only.
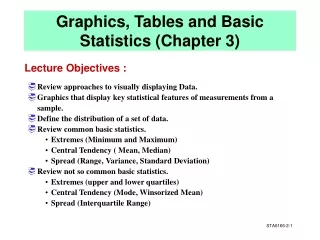
Charts and Graphs • Pie charts: relative portions of a total amount • Column and bar charts: side-by-side comparisons • Graphs: changes over time • Info-graphics: hybrid form using charts, graphs, illustrations, and symbols to illustrate a concept.
Tables, Charts, Graphics: Guidelines • Use descriptive titles. • Indicate source of information. • Add labels where necessary. • Place tables, charts, graphics just after first point of reference. • Refer to tables, charts, graphics just before their occurrence. • In the cross-reference, briefly identify the main point of the table, chart, graphic. • Align tables, charts, graphics to their parent text.
Info-Graphic 32-bit registers give a processor a range of 232, or 4.3 billion—which means it can express integers from 0 to 4.3 billion. With 64-bit registers, the dynamic range catapults to 2 64, or 18 billion billion—4.3 billion times larger than the range of a 32-bit processor (the difference between the size of a postcard and the size of Manhattan island). Conceptual graphic designed by Apple Computer, Inc., to provide a sense of the advance that 64-bit processors represent over 32-bit processors. Source: Apple Computer, Inc.