Download
1 / 32
320 likes | 549 Views
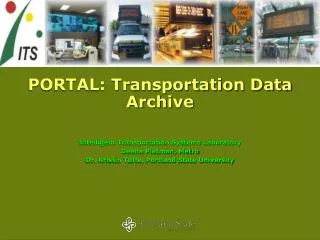
PORTAL: Transportation Data Archive Intelligent Transportation Systems Laboratory Deena Platman, Metro Dr. Kristin Tufte, Portland State University. PORTAL Background Developed with CAREER grant from National Science Foundation with additional financial support from FHWA

E N D
PORTAL: Transportation Data Archive Intelligent Transportation Systems Laboratory Deena Platman, Metro Dr. Kristin Tufte, Portland State University
PORTAL Background • Developed with CAREER grant from National Science Foundation with additional financial support from FHWA • Large investment in developing regional transportation archive • Funding Situation • Current funding has run out, archive will wither • Need sustainable funding source
What’s in the PORTAL Database? Loop Detector Data 20 s count, lane occupancy, speed from 500 detectors (1.2 mi spacing) Bus Data 1 year stop level data 140,000,000 rows Incident Data 140,000 since 1999 Data Archive Days Since July 2004 About 700 GB 4.2 Million Detector Intervals VMS Data 19 VMS since 1999 Weather Data
PORTAL Web Site • Graphical display of archived data – Speed, Weather, Incidents, TriMet AVL • Performance Reports, Traffic Counts, Freight Data, …
Speed Plot & Incident Reports • 20,000 reported incidents/year • 92 Database fields • 4 Entries per incident Incident on NB I-205, log truck rear-ended a nursery truck, two cars also involved, duration over 4 hours. 11/15/2005 Northbound I-205
8:15 2-vehicles collide 8:19 Crash reported 8:27 VMS message: CENTER LANES CLSD 8:40 COMET requests tow 9:10 Tow arrives 9:27 Lanes clear 9:30 Traffic starts to clear 9:45 Traffic half clear 10:00 Traffic all clear Uses of PORTAL • Resource for local transportation professionals • Metro RTP (?) • Projects • SWARM • Travel Time • Bottleneck Identification • Data Quality Evaluation • Gap Filling • TriMet Data Analysis • Freight Data Display • Incident Autopsy
Metropolitan Mobility the Smart Way Deena – Are any of these the RTP slides you wanted?
Portal In Action: Metropolitan Congestion Over Time Winter Spring Summer Fall 2004 2005 2006
Cross Section Study Speed Speed Speed-Volume Analysis (2005) Volume ‘05 2004-05 Speed Comparison ‘04
Cross Section Comparison Looming Danger Good Free-flow performance Design Flaws Geographic Bottlenecks Mega-project!
9/21 (SWARM) & 9/28 Pre-Timed Speeds dropped prior to activation Pre-Timed Metering Activation SWARM Note: SWARM Metering Activation Data not collected at Foster Metering activated earlier under SWARM Despite a slightly higher metering rate, SWARM’s earlier activation appeared to delay the onset of congested speeds and allowed for higher and more stable mainline flows.
What’s Behind the Scenes? Database Server PostgreSQL Relational Database Management System (RDBMS) Development Server CentOS Linux distribution Web Interface Storage 2 Terabyte Redundant Array of Independent Disks (RAID)
Performance Measures Used • Volume • Speed • Occupancy • Vehicle Miles Traveled • Vehicle Hours Traveled • Travel Time • Delay • In near future will add: Fuel Consumption, Emissions, Carbon Measures
Incident Reports • 20,000 reported incidents/year • 92 Database fields • 4 Entries per incident Incident on NB I-205, log truck rear-ended a nursery truck, two cars also involved, duration over 4 hours. 11/15/2005 Northbound I-205
Mapping – Speed Subtraction Difference July-December 2005 Average Evening Peak Speed (5-6 pm)
Incident Reports Incident on NB I-205, log truck rear-ended a nursery truck, two cars also involved, duration over 4 hours. Incident on SB I-205, NB effects visible 11/15/2005 Northbound I-205
10/1 (Pre-Timed)& 9/17 (SWARM) (1) SWARM activation matches drop in speed (4) SWARM appears to implement a lower metering rate, responding to lower speeds. (2) But metering at Sunnyside (and likely Foster) activated later under SWARM than Pre-Timed (3) Slightly higher metering rates under SWARM than Pre-Timed
SWARM Summary • SWARM allows more vehicles onto the freeway at each on-ramp. • Counter to ODOT’s initial assumptions • Pilot study on OR-217 SB demonstrated a tradeoff between decreased ramp delay and increased mainline delay • Could not conclude that higher on-ramp volumes were the sole cause. • SWARM’s earlier activation times reduce mainline delay under some conditions. • Adjustment of metering rates and other SWARM parameters is needed to improve performance of the system • Communications failures impact quality of SWARM operation • Tradeoff between frequently updating ramp metering plans, and increased need for maintenance and tuning w/adaptive system • Logging capabilities for SWARM/ATMS would make evaluation efforts easier • Ramp queue loop detectors, meter activation times, and actual metering rates set by the SWARM system
Travel Time Estimation Error • 85% of runs within error threshold of 20%
Real Time Travel Time Estimation • Goal: Assess accuracy of current travel time estimates and suggest improvements • Analysis • 500 ground truth runs (GPS-enabled iQue) • Compared ground truth with estimates using PORTAL data • Results • Average error 11% • Identified need for additional detection • Methods for evaluating benefits of additional detection
Sensor Data Quality • ODOT products (speed map, ramp metering) are only as good as the input data • Use PORTAL to identify poorly performing detectors; prioritize maintenance on those detectors (improve efficiency) • Key Question: How do data anomalies correlate with problems in the field?
Correlated information can help find mechanisms for filling the data gaps A B C S S S A B C Direction of flow ˆ = ( , ) S f S S B A C By looking at available information from nearby stations, models fitted on historical data can provide an online estimate of the missing conditions. Different choices of estimation models exist, some more computationally intensive than others. Gap Filling
Incident Autopsy: 6/12/06 8:15 2-vehicles collide 8:19 Crash reported 8:27 VMS message: CENTER LANES CLSD 8:40 COMET requests tow 9:10 Tow arrives 9:27 Lanes clear 9:30 Traffic starts to clear 9:45 Traffic half clear 10:00 Traffic all clear
Incident Autopsy: 6/12/06 5000 Crash 4500 4000 Tow Arrives 3500 3000 2500 vehicles per 5 minutes All Traffic Clear 2000 1500 All Lanes Clear 1000 500 0 10:20 10:30 10:40 10:50 11:00 10:10 08:00 08:10 08:20 08:30 08:40 08:50 09:00 09:10 09:20 09:30 09:40 09:50 10:00