Role of IL-22, IL-17A, and IL-17F mRNA Levels in Cellular Responses to FICZ Exposure
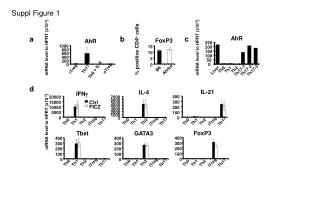
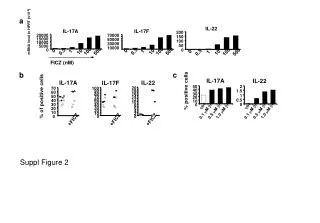
This analysis focuses on the mRNA expression levels of key cytokines, IL-22, IL-17A, and IL-17F, in response to different concentrations of FICZ. The study examines the correlation between these cytokines and the number of positive cells, assessing variations under control conditions and different concentrations of bNF. The findings may provide insights into the inflammatory pathway activation and immune responses influenced by FICZ, contributing to the understanding of cytokine regulation in experimental models.

Role of IL-22, IL-17A, and IL-17F mRNA Levels in Cellular Responses to FICZ Exposure
E N D
Presentation Transcript
IL-22 20 18 100 16 90 14 80 12 70 10 60 8 50 6 40 4 30 2 20 0 10 0 a IL-22 IL-17A IL-17F mRNA level to HPRT (x10-3) 200 20000 70000 150 15000 50000 100 10000 30000 50 5000 10000 0 0 0 0 1 1 100 100 500 500 0 0.5 0.5 10 10 100 1 500 0.5 10 FICZ (nM) b c IL-17A IL-22 IL-17A IL-17F 2 50 70 40 % positive cells 1.5 60 30 1 % of positive cells 50 20 0.5 40 10 30 0 0 ctrl ctrl 1.0 mM bNF 0.5 mM bNF 1.0 mM bNF 0.5 mM bNF 0.1 mM bNF 0.1 mM bNF 20 10 0 +FICZ +FICZ +FICZ Suppl Figure 2