Transduction of Pmel-1 T Cells Using Retroviral Vectors: Experimental Protocol
This study presents a detailed protocol for transducing Pmel-1 T cells with retroviral vectors MSCV-tsFL/sr39TK-IRES-YFP. Lymph nodes and spleens from Pmel-1 mice were cultured with IL-2 and gp10025-33 peptide, followed by infection with MSCV-tsFL-YFP retrovirus. Cell lysates were prepared for luciferase activity assessment and FACS analysis to evaluate transduction efficiency.

Transduction of Pmel-1 T Cells Using Retroviral Vectors: Experimental Protocol
E N D
Presentation Transcript
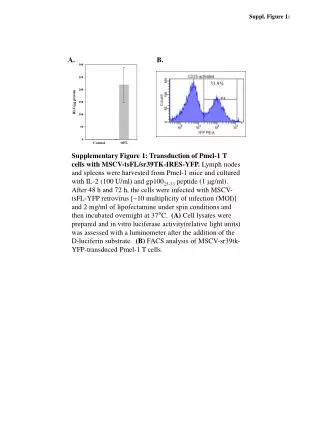
Suppl. Figure 1: A. B. 31.9% Supplementary Figure 1: Transduction of Pmel-1 T cells with MSCV-tsFL/sr39TK-IRES-YFP.Lymph nodes and spleens were harvested from Pmel-1 mice and cultured with IL-2 (100 U/ml) and gp10025-33 peptide (1 mg/ml). After 48 h and 72 h, the cells were infected with MSCV-tsFL-YFP retrovirus [~10 multiplicity of infection (MOI)] and 2 mg/ml of lipofectamine under spin conditions and then incubated overnight at 37°C. (A) Cell lysates were prepared and in vitro luciferase activity(relative light units) was assessed with a luminometer after the addition of the D-luciferin substrate. (B) FACS analysis of MSCV-sr39tk-YFP-transduced Pmel-1 T cells.