Download
1 / 37
370 likes | 660 Views
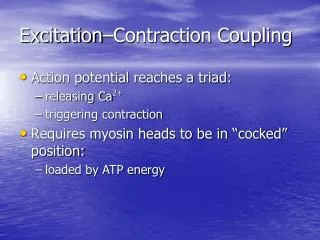
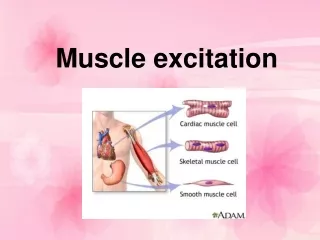
Heart Excitation. Heart Excitation. Cardiac muscle cells are excitable (with electrical stimulation they will contract, leading to the contraction of the heart) Contraction of heart leads to pumping of blood.

E N D
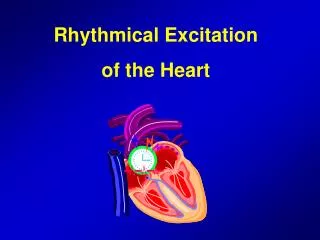
Heart Excitation • Cardiac muscle cells are excitable (with electrical stimulation they will contract, leading to the contraction of the heart) • Contraction of heart leads to pumping of blood
Specialized Tissues (important in the regulation and coordination of electrical activity) Sinoatrial node (SA node) • located in wall of right atrium • hearts pacemaker • where electrical signals originate and lead to contraction, sets the rate of contraction, at rest about 72-84 bpm • causes atria to contract force blood into ventricles
Atrioventricular Node (AV node) • passes electrical signal to ventricles from the atria • passes electrical signal to bundle of His Bundle of His(atrioventricular bundle) • special tissue within ventricular septum • Splits to form the right and left bundle branches • pass signals to Purkinje fibres
Purkinje fibres • pass signal to myocardium in ventricles Atria initiate contraction from top down, push blood into ventricles • Ventricles contract bottom up – push blood into aorta and pulmonary arteries • SA node can be influenced by another source and can increase or decrease force of contraction (HR) • eg. exercise, increased adrenaline, drugs • If SA node is damaged the AV node takes control
Electrocardiogram • An electrocardiogram (ECG or EKG, abbreviated from the GermanElektrokardiogramm) is a graphic produced by an electrocardiograph, which records the electrical voltage in the heart in the form of a continuous strip graph. • It is the prime tool in cardiac electrophysiology, and has a prime function in the screening and diagnosis of cardiovascular diseases. • The electrocardiogram does not assess the contractility of the heart.
Normal ECG A typical ECG tracing of a normal heartbeat consists of a P wave, a QRS complex and a T wave. P wave – atrialdepolarization (spreading of the electrical signal to contract through the atria). • Both the left and right atria contract simultaneously. • Immediately after depolarization of the atria there is repolarization (readies for another contraction)
QRS complex – depolarization of ventricles • contraction of the left and right ventricles, which is much more forceful than that of the atria and involves more muscle mass, thus resulting in a greater ECG deflection. • Slight dip, followed by steep peak, then a quick return back to near baseline levels • The duration of the QRS complex is normally less than or equal to 0.10 second.
Normal ECG T wave – represents the repolarization of the ventricles. Electrically, the cardiac muscle cells are like loaded springs. A small impulse sets them off, they depolarize and contract. Setting the spring up again is repolarization • ECG abnormalities may indicate heart problems or disease
Current that causes Left and right ventricle contraction “ventricular depolarization” Current that causes Left and right atrial contraction “atrial depolarization” Current that causes “repolarization” of the ventricle contraction
Heart Complications • Atherosclerosis = narrowing of coronary arteries caused by plaque • Angina = chest pain caused by atherosclerosis • Myocardial infarction = part of the myocardium not receiving blood supply • Cardiac arrest = heart stops • Aneurysm =a balloon-like bulge in an artery that weakens and bursts
Components of Blood • Plasma • Liquid portion of blood • Contains ions, proteins, hormones • Cells • Red blood cells (erythrocytes) • Contain hemoglobin to carry oxygen • A protein that gives blood the ability to • Deliver oxygen and take out carbon dioxide • White blood cells (leukocytes) • Important for fighting infection and your immune system • Platelets (thrombocytes) • Important in blood clotting
Blood Pressure • Purpose? • To measure the efficiency of the heart and the condition of the blood vessels HOW DO WE MEASURE BLOOD PRESSURE?
Measuring Blood Pressure • Use a sphygmomanometer cuff and a stethoscope on the brachial artery • Increase pressure to about 150mmHg • Release the pressure and listen for the first “lub dub” sound (systolic pressure) • Wait until the artery returns silent (diastolic pressure)
Cardiac Cycle Is a series of events that occurs through one heart beat. Systole ~ phase of contraction – ventricles contract - the heart ejects the blood Diastole ~ phase of relaxation – ventricles relax - heart is filling with blood
Blood Pressure Readings • Average: 120/80mmHg • Hypotension: lower than 90/60mmHg • Pre-hypertension: 120-139/80-89mmHg • Hypertension: 140-149/90-99mmHg • Severe hypertension: 160/100mmHg plus
Hypotension • Not usually a concerns unless dizziness, light-headedness and fainting occur • Caused by: • bleeding or haemorrhaging • Allergic reaction • pregnancy
Risk Factors of High Blood Pressure/Hypertension • Age • Race • Gender • Heredity • Diet (high fat) • Stress • Inactivity • Alcohol and smoking
Treatments • 1. Medication • Diuretics to lower blood volume • Inhibitors to relax blood vessels • 2. Diet • Decrease fat and sodium intake • 3. Exercise • Strengthens heart muscle • Releases endorphins (decrease stress) • Gradual increase in activity is important
Cardiovascular Dynamics • How the heart adapts to meet the demands of increased workload
Cardiac Output (Q) • volume of blood pumped out of the left ventricle in 1 minute • measured: L/min • at rest ~ 5-6 L/min Two factors that contribute to cardiac output: • Stroke Volume (SV) • Heart Rate (HR) Q = SV x HR
Stroke Volume • amount of blood that is ejected from the left ventricle in a single beat • measured in mL Heart Rate • The number of times the heart contracts in a minute (beats/min)
Calculating Cardiac Output • Cardiac output is the product of stroke volume and heart rate: Q (L/min) = SV (mL) X HR (beats/min) • Example: HR at rest ~72 beats/min, SV at rest ~71 mL Q resting (L/min) = 72 beats/min X 71 mL = 5112 mL/min (5.11 L/min)
Cardiac Output and Exercise • Q increases to 15-25 L/min (depending on intensity of exercise) • Q increases then becomes constant • SV increase occurs early in exercise and plateaus • HR increases early (same as above) • Prolonged exercise SV might decline late in exercise (due to excessive fluid loss from body – sweating) • Q is maintained because HR increases
What happens with training? • Q (cardiac ouput) • Rest 5-6 L/min • Exercise 35-45 L/min • Stroke volume • Untrained male at rest 70-80 mL/beat • Highly trained male 100-110 mL/beat • Highly trained endurance 150-170 mL/beat Therefore, with training we can pump out more blood with less beats = more efficient system
What enables the increase of SV? • Frank starling Law: the ability of the heart to stretch and increase the force of the contraction and thus the amount of blood that is ejected. • This is mostly effected by the amount of blood returned to the heart VENOUS RETURN
VENOUS RETURN • (VR) increases during exercise by • Venoconstriction • The skeletal muscle pump • The thoracic pump • Nervous stimiulation (increased HR)
Ejection Fraction • Measures the efficiency of SV • EF is recorded in a % • The portion of blood that is ejected from the left ventricle • EF at rest = 50-60% • EF max ex. = 85% EF % = SVx 100 LVEDV
Athlete’s Heart Volume Load Pressure Load Anaerobic activities Ventricle wall thickness increases to push blood out faster Little change to ventricle chamber size • Endurance athlete’s • Increase size of the ventricle chamber • Little change to ventricle wall
Hypertrophic Cardiomyopathy (HCM) • Enlarged ventricle wall • Muscle fibres of the heart are not connected properly and become intertwined and enlarged • Present at birth • Kills with no symptoms