Download
1 / 10
110 likes | 130 Views
Learn about changes in Hudson River water levels through graphs. Interpret tide patterns at various locations, predict tides, and analyze data to understand the river's behavior. Discover the impact of tides and sea level on the river ecosystem. Contact the Hudson River Estuary Program for more information.

E N D
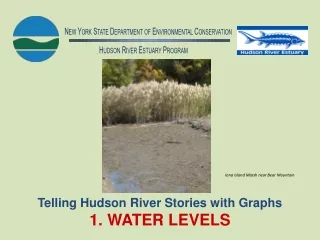
Hudson River Estuary Program New York State Department of Environmental Conservation Iona Island Marsh near Bear Mountain Telling Hudson River Stories with Graphs 1. WATER LEVELS
Changes in water levels can be shown using line graphs. Where? How high? When? Source: USGS Hudson River Salt Front website
Interpreting graphs: What is the story that each graph tells? Answer these questions when looking at each graph: 1. What time period is shown in this graph? 2. What is being measured in this graph? 3. Where was the information gathered? 4. What happens to it over the time period shown? 5. What is your hypothesis about what caused this to happen? 6. Measurements of what other parameters would help you test and verify your hypothesis? If you have Internet access, you can go to the Hudson Environmental Conditions Observing System website to check other parameters and test your hypothesis.
How do changes in water level differ at these two Hudson River sites? Create a hypothesis to account for the different plots at these sites. Source: USGS Current Conditions for New York: Surface Waters
From the city of Troy south, the surface of the Hudson is at sea level – the same level as the surface of the ocean. At Sandy Hook on the Atlantic Ocean, is the sea’s surface always at the same level, or does it rise and fall? Why? 2013 Source: New York Harbor Observing & Prediction System
Because the Hudson is at sea level from Troy to the ocean, tides make the river rise and fall here. Troy How many high tides occur daily at any spot on the river? How many low tides? How long does it take to go from low tide to the next high tide? From a low tide to the next low? Source: Hudson River Environmental Conditions Observing System
Low and high tides occur in a cycle. Based on this graph, predict the times of high and low tides at Poughkeepsie on November 19.
This graph shows tides at Poughkeepsie and at Albany during the same time period. How are tides different at the two locations? 2013 Source: Hudson River Environmental Conditions Observing System
What is the tide doing on the Hudson now…. • … at the Battery in Manhattan? • Visit the National Oceanic & Atmospheric Administration’s Battery tide gauge website. • … near where you live? • Visit the HRECOS web page to find the station nearest your home. Go to the Current Conditions page, select that station. Choose the Depth or Water Elevation parameters; click on Plot. • Want to know when the tide will be high or low tomorrow? Next week? Months from now? • Visit the National Oceanic & Atmospheric Administration’s tide predictions website for New York, scroll down to the list of Hudson River stations, and click on the one nearest you.
For more information, contact:Steve Stanne, Education CoordinatorNYSDEC – Hudson River Estuary Program/New York Water Resources Institute – Cornell University21 South Putt Corners RoadNew Paltz, NY 12561845 256-3077spstanne@gw.dec.state.ny.us