Download
1 / 22
220 likes | 381 Views
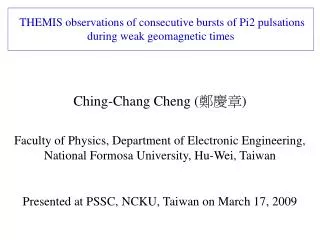
Study of Pi2 pulsations observed from MAGDAS chain in Egypt. E. Ghamry 1 , 2 , A. Mahrous 2 , M.N. Yasin 3 , A. Fathy 3 and K. Yumoto 4 1- National Research Institute of Astronomy and Geophysics, NRIAG, Helwan.

E N D
Study of Pi2 pulsations observed from MAGDAS chain in Egypt E. Ghamry1, 2, A. Mahrous 2, M.N. Yasin3, A. Fathy3 and K. Yumoto4 1- National Research Institute of Astronomy and Geophysics, NRIAG, Helwan. 2- Space Weather Monitoring Center (SWMC), Helwan University, Ain Helwan 11795, Egypt. 3- Physics Department, Faculty of Science, Fayoum University 4- SERC, Kyushu University, Japan. E-Mail: a_fathyallam@yahoo.com
Outlines:- [1]. Introduction [2]. Analysis method [3]. Studying the generation mechanism of Pi2 pulsation observed at two low latitudinal stations through studying . 1. The local time frequency dependence. 2. The relation between the amplitude and the Local time. 3. the frequency variation of 10 successive Pi2 events 4. Studied the relation between the frequency of Pi2 pulsations, and the level activity{ measured by Kp index } 5. Studied the properties of the Pi2 pulsation observed through the main and the recovery phase of the magnetic storm in July/22/2009 [4]. Studied the propagation mechanism of Pi2 pulsations at two low latitudinal stations. [5]. Conclusion.
Introduction:- Irregular Pi2 pulsations one of the most important Magnetohydromagnetic waves ( indicator to the onset of the geomagnetic substorms at low latitudes ) observed on the earth’s surface, which had studied more extensively at high latitudinal region, while still in debates at low latitudinal region, we had studied the Pi2s observed at two latitudinal stations ( FYM and ASW ) in Egypt, includes to MAGDAS Project ( one of the most extensive magnetometers distributed all over the world ). In the following study we tried to clarify the generation mechanism of Pi2s observed at low latitude stations in Egypt.
Analysis method • Period of analysis [ Nov 2008 to Oct 2009]. • Filtered data through the second order butter worth band pass filter in the period range of the Pi2 (40:150) second [ Identify the waveform and the amplitude ] of the Pi2 pulsations. • Correlating the Pi2 with magnetic disturbance measured with AL index ( Negative bays 120 nT) • Estimating the frequency of Pi2 pulsations through two different methods • 1. Fast Fourier transformations • 2. The wavelet power spectrum method. ( using meyer base function). • We determined the time delay through timing the maximum energy H component.
The relation between the Number of events and the average frequency variations The dominant frequency ~ 9.7 mHz
Local time frequency dependence, H Component. For all 152 Pi2 events at all Kp level activity. Pi2 H component have the frequency at both stations Solid line : Average hourly variation Max Frequency at 5 LT Min frequency in [17:21 ] Relatively high frequency [ 21 : 24 }
Local time frequency variation for Low level activity { Kp<3 } Comparable frequency [0 : 16 ] LT. Min frequency [ 17 : 20 ]. Max frequency 21 LT
The relation between Amplitude and localtime [LT] Max amplitude around local midnight. Pi2 pulsations at both stations have insignificant difference in amplitude Pi2 at both stations has the same waveform .
The last result suggest two possible generation mechanism. Plasmapause surface waves due to local time frequency dependence, or the Cavity Resonance ( Magnetospheric/ Plasmaspheric ). Pi2 observed have the following characteristics • The same waveform. • The same periodic oscillation To suggest one of them we have to investigate if Pi2s is a global event. If global Pi2 has a discrete frequency, with the last two condition, it may be generated from cavity mode resonance.
Successive pi2 events Fast Fourier Transformation (FFT) 3 successive Pi2 events with Kp=1, the most right column show the dominant frequencies 11.7 , 12.7 and 11.7 mHz respectively for the three successive events, the upper panel show the raw data H component , the middle left panel show the filtered data in the Pi2 range and the bottom panel show the wavelet power spectrum through 24-12-2008 FYM station.
frequency of both events are 11.7 and 13.7 mHz respectively, the panels from top to bottom show the following (i). AE and AL index, (ii) Pi2 at FYM station, (ii). Pi2 at ASW station, (iii)wavelet power spectrum frequency vs UT for 27-3-2009, the color code illustrate the power amplitude. Estimation of the frequency of pi2 pulsations through wavelet power spectrum are 9.7 and 11.7 mHz respectively, through 20-2-2009 for kp=1, for both FYM and ASW station, the color code illustrate the power amplitude.
Comparing the frequency of Pi2 events at the dawn and the duskside, have the following conditions 1. the same level activity2. the maximum density =18 Cm-3 Precluded the FLR, and Plasmapause surface waves
Frequency Kp level activity dependence Preclude FLR
Case study through magnetic storm July/22/2009 The magnetic field and solar wind parameters are. Vsw= 443.6 Km/S Kp =6 in the main phase and Kp= 2 in the recovery phase during the analysis interval of Pi2 pulsation. Dst index = -82 nT.
Through the main phase .label (a) the AE and the AL index, (b) The Dst index (c) The raw H component at ASW, (d) The filtered data in the range [ 40:150 ] second. and label (e) the wavelet power spectrum, two Pi2 have 15.6mHz
Through the recovery phase Discrete frequencies 12.7 , 15.6 and 12.7 mHz of three consecutive substorms respectively,
Propagation of Pi2 pulsations Pi2 observed at FYM and ASW station during 20-2-2009,time difference for the first and the second event are 11 and 13 second respectively Pi2 observed at FYM and ASW station during 8-3-2009,time difference for the first and the second event are 25 and 23 second respectively
Time delay between FYM and ASW stations during 7-6-2009 Pi2 observed at FYM and ASW station during 7-6-2009,time difference is 49 Second.
Always FYM station lagging from ASW by [ 3:50 ] second in all local time sectors used in our analysis [17 : 5 ] LT. • The time delay decrease with approaching the local midnight. • The result is consistent with the model of Uozumi et al (2009). And GUO-HUA FAN et al (2000).
Conclusion • Pi2 pulsations H component have the same frequency, waveform, and a comparable amplitude at both stations. • Frequency of Pi2s showed geomagnetic activity dependence • We suggest that the cavity mode resonance ( especially plasmaspheric) is a possible generation mechanism • Always Pi2s observed at ASW lead FYM station.