Download
1 / 13
130 likes | 423 Views
Math III U1D2 Warm-up: 1. Is it possible for a data set to have a standard deviation of 0? If so, give an example. If not, tell why not. A data set can have a standard deviation of 0 – it will occur when all of the values in the set are the same, such as 8, 8, 8, 8, 8, 8, 8.

E N D
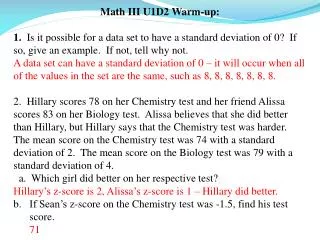
Math III U1D2 Warm-up: 1. Is it possible for a data set to have a standard deviation of 0? If so, give an example. If not, tell why not. A data set can have a standard deviation of 0 – it will occur when all of the values in the set are the same, such as 8, 8, 8, 8, 8, 8, 8. 2. Hillary scores 78 on her Chemistry test and her friend Alissa scores 83 on her Biology test. Alissa believes that she did better than Hillary, but Hillary says that the Chemistry test was harder. The mean score on the Chemistry test was 74 with a standard deviation of 2. The mean score on the Biology test was 79 with a standard deviation of 4. a. Which girl did better on her respective test? Hillary’s z-score is 2, Alissa’s z-score is 1 – Hillary did better. If Sean’s z-score on the Chemistry test was -1.5, find his test score. 71
CW Check: Using Z-Scores to pick a Winner Drawing a picture to visualize helps! What are the winning Z-Scores for each event? Competitor BCompetitor ACompetitor C 100 m dash Shot PutLong Jump -0.5 22.5 What percent is this better than? Normalcdf(0,9.9,10,.2) Normalcdf(0,66,60,3)Normalcdf(0,27.25,26,.5) .3085 .9772 .9938 So better than….. 69.15%97.72%99.38% So the winner is? Competitor C
HW Check: Working with Z-Scores 1. (a) 240 (b) 9 (c) no, because the tests are scaled differently. A student could make a perfect score on the ACT and the numerical value would be substantially less than a low scoring SAT score. (d) 240/240 = 1 (e) 9/6 = 1.5 (f) Kathy did (g) Kathy did (h) Peter: (1380 – 1500)/240 = -0.5 Kelly: (15 – 21)/6 = -1 (i) Peter has a higher score (j) a negative z-score means that you are below the mean. Golf scores, track times, or swimming times would be examples of beneficial negative z-scores.
HW Check: Working with Z-Scores 2. (a) (13.9 – 12.5)/1.5 = 0.933 (b) Benjamin’s weight is higher than the mean weight for children of his age, but he is within 1 standard deviation of the mean. (c) 0.933 = (x – 17.25)/2.0 = 19.116 lbs 3. (a) John: (81 – 69.3)/2.8 = 4.18; June: (74 – 64)/2.7 = 3.703; John is taller (b) 1.5 = (x – 64)/2.7 = approx 68 inches (c) Man: -0.5 = (x – 69.3)/2.8 = 67.9 inches; woman: 1.2 = (x – 64)/2.7 = 67.24 inches; man is taller
HW Check: Working with Z-Scores 4 (a) (b) Toni’s highest score was in logical reasoning. Her lowest was in Mechanical ability – this is the only test on which she was below the mean. -
Objective: • To use calculators, spreadsheets and tables to estimate area under the normal curve.
ACTIVITY: • Divide into groups of 3. • Each student should record, to the nearest quarter of an hour, how many hours he/she slept in the past 24 hours. • Answer questions based upon their answers and a previously conducted survey regarding the number of hours of sleep of high school students.
1. How long did the person who slept the longest in your group sleep? What percent of high school students from the survey slept longer than this person? 2. How long did the person who slept the least in your group sleep? What percent of high school students from the survey slept less than this person? 3. How long did the middle person (not the least or the most hours) in your group sleep? What percent of high school students from the survey slept between the hours slept by this person and the hours slept by your group's "most" person? 4. Another student, Edward, joins your group and says that he slept 8.5 hours. What percent of high school students from the survey slept less than Edward? 5. Your Principal comes into your class and announces that he slept 7.25 hours. What percent of high school students from the survey slept longer than the Principal? 6. What percent of the data in the survey lies in the interval from 5.75 to 8.25 hours? 7. What interval about the mean includes 95% of the data in the survey? 8. What interval about the mean includes 50% of the data in the survey?
SOLUTIONS 1. How long did the person who slept the longest in your group sleep? What percent of high school students from the survey slept longer than this person? answers will vary based on group responses 2. How long did the person who slept the least in your group sleep? What percent of high school students from the survey slept less than this person? answers will vary based on group responses3. How long did the middle person (not the least or the most hours) in your group sleep? What percent of high school students from the survey slept between the hours slept by this person and the hours slept by your group's "most" person? answers will vary based on group responses 4. Another student, Edward, joins your group and says that he slept 8.5 hours. What percent of high school students from the survey slept less than Edward? 88.5% [normalcdf (0, 8. 5, 7, 1.25)] 5. Your Principal comes into your class and announces that he slept 7.25 hours. What percent of high school students from the survey slept longer than the Principal? 42.1% [normalcdf (7.25, 100, 7, 1.25)] 6. What percent of the data in the survey lies in the interval from 5.75 to 8.25 hours? 68% by Empirical rule; 68.3% by calculator [normalcdf (5.75, 8.25, 7, 1.25)]7. What interval about the mean includes 95% of the data in the survey? 4.5 – 9.5 hours of sleep (add and subtract two standard deviations from the mean) 8. What interval about the mean includes 50% of the data in the survey? 6.2 – 7.8 hours of sleep [find lower bound using InvNorm (.25, 7, 1.25); find upper bound using InvNorm (.75, 7. 1.25)]
Classwork: The Normal Distribution WS
Homework: Practice with Normal Distribution AND have your parent read the class letter online then sign & return the actual CCM III acknowledgement sheet for me.