Download
1 / 22
220 likes | 367 Views
New Statistical Tests, continued…. Analysis of Variance and F Test. Analysis of Variance. The T test allows us to test whether two means are statistically significantly different.

E N D
New Statistical Tests, continued… Analysis of Variance and F Test
Analysis of Variance • The T test allows us to test whether two means are statistically significantly different. • We now want to ask if we can test whether the means of more than two groups are statistically significantly different from one another. • We are testing a relationship between a categorical independent variable and an interval dependent variable.
An Example… • Do the responses of students in the 1973 Premarital Sexuality Survey differ by the year in school of the student? • Do the students’ estimates of the proportion of female students having sexual intercourse differ by whether they are freshmen, sophomores, juniors, or seniors?
The Data • The mean response for all the students was 47.5%. • The response by year in school was: • 1 42.1 • 2 45.9 • 3 50.1 • 4 52.0
The Data • The mean response for all the students was 47.5%. • The response by year in school was: • 1 42.1 • 2 45.9 • 3 50.1 • 4 52.0 • Null hypothesis: The differences observed are the result of chance.
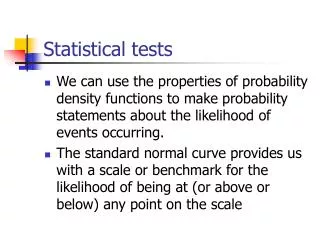
Concepts • What is the overall variation in the responses? • We calculate an overall mean response and a measure of dispersion, standard deviation and variance. • We can calculate a mean response and a measure of dispersion, standard deviation and variance for each group.
Another Example… • From the data collected by Roger Simon on Milwaukee in 1905, are their differences in the mean number of people per family according to the type of building the family lives in., e.g., a cottage, a duplex, or a “residence.”
Concepts • We partition the total variation or variance into two components: • (1) variance which is a function of the group membership, that is the differences between the groups; and • (2) variance within the groups. • More formally: Total Sum of Squares = Between Groups Sum of Squares + Within Groups Sum of Squares
Equation • Total Sum of Squares = Within Groups Sum of Squares + Between Groups Sum of Squares • TSS= SSW + SSB
Calculations Case number VAR00001$ GPMEAN GRANDMN VARIANCE N NMINUS1 SSW SSB 1 cottage 5.332 5.030 4.969 277.000 276.000 1371.444 25.264 2 duplex 4.410 5.030 3.537 83.000 82.000 290.034 31.957 3 residenc 4.842 5.030 4.628 171.000 170.000 786.760 6.044 4 total 5.030 5.030 4.739 531.000 . . .
Degrees of Freedom • DF between = k -1 • DF within = N – k • Website for F Table: • http://www.itl.nist.gov/div898/handbook/eda/section3/eda3673.htm#ONE-05-1-10
SPSS Output • Sum of Squares from previous slide • Degrees of Freedom: k-1 and N-k • Mean Square = Sum of Squares/df • F = Mean Square Between/Mean Square Within
Website for F Table • http://www.itl.nist.gov/div898/handbook/eda/section3/eda3673.htm#ONE-05-1-10
Strength of the Relationship • Since Total Sum of Squares = Within Groups Sum of Squares + Between Groups Sum of Squares or TSS= SSW + SSB…. • Between Groups Sum of Squares/Total Sum of Squares = Proportion of Variance Explained or Eta Squared • SSB/TSS = Eta Squared • Eta Squared is equivalent to R Squared