Supplemental Figure 1
100 likes | 149 Views
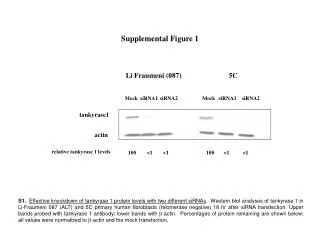
Supplemental Figure 1. Li Fraumeni (087). 5C. Mock. siRNA1. siRNA2. Mock. siRNA1. siRNA2. tankyrase1. actin. relative tankyrase 1 levels. 100 <1 <1 100 <1 <1.

Supplemental Figure 1
E N D
Presentation Transcript
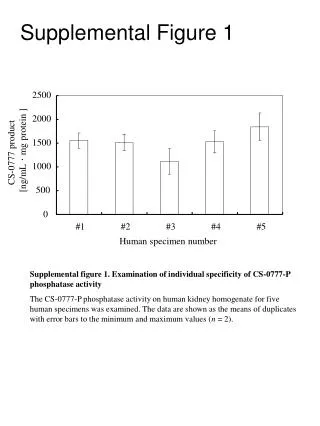
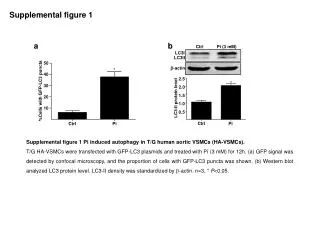
Supplemental Figure 1 Li Fraumeni (087) 5C Mock siRNA1 siRNA2 Mock siRNA1 siRNA2 tankyrase1 actin relative tankyrase 1 levels 100 <1 <1 100 <1 <1 S1.Effective knockdown of tankyrase 1 protein levels with two different siRNAs. Western blot analyses of tankyrase 1 in Li-Fraumeni 087 (ALT) and 5C primary human fibroblasts (telomerase negative) 18 hr after siRNA transfection. Upper bands probed with tankyrase 1 antibody; lower bands with -actin. Percentages of protein remaining are shown below; all values were normalized to -actin and the mock transfection.
Supplemental Figure 2 Li-Fraumeni 5c S2.Increased radiation-induced cell killing (reduced survival) with reduced levels of tankyrase 1. Li-Fraumeni and 5C fibroblasts were treated with tankyrase 1 siRNA, then were exposed to -rays and the surviving fractions determined by clonogenic assay. Points are averages of three experiments; error bars are standard deviations. Mock transfection (), tankyrase 1 siRNA transfection (o). Cell cycle distributions were assessed by flow cytometry and found to be unaffected by tankyrase 1 depletion. Cell cycle analyses were performed as described on the next page.
SUPPLEMENTAL FIGURE 2, continued Cell cycle distributions were determined as follows: eighteen hours after transfection with tankyrase 1 siRNA, or mock-transfection with Lipofectamine 2000 reagent only, cells were trypsinized and resuspended in two ml cold PBS. Two ml cold 100% ethanol was added dropwise while vortexing the cells vigorously. Three ml cold 100% ethanol was added to bring the final ethanol concentration to 70%. Fixed samples were refrigerated for a minimum of 20 minutes before staining. Ethanol was aspirated, and cell pellets resuspended in 1 ml of propidium iodide (PI, 50ug/ml in PBS; Invitrogen) with RNAse (40 KU/ml; Sigma-Aldrich) added. All cell samples were analyzed with the EPICS IV Flow Cytometer (DakoCytomation, Inc., Fort Collins, CO) using a 488 nm laser.
DNA-PKcs tankyrase 1 actin Supplemental Figure 3 marker Mock 24 hr 48 hr 72 hr 250 kD 150 kD 100 7 7 92 DNA-PKs S3. Tankyrase 1 siRNA knockdown reduces DNA-PKcs protein levels in WTK1 human lymphoblasts. Cells were transfected with tankyrase 1 siRNA or were mock transfected. Protein levels of DNA-PKcs, tankyrase 1, and -actin were determined 24, 48 or 72 hr after transfection. Time course demonstrates tandem reduction and recovery of tankyrase 1 and DNA-PKcs. Percentages of protein remaining are shown below the western; all values were normalized to -actin and the mock transfection. tankyrase 1 100 <1 <1 12
Supplemental Figure 4 XAV939 μM 0 1.0 1.0 1.0 MG132 μM 0 0 12.5 50.0 RE 100 23.56 34.17 37.90 S.4. Proteosome inhibition facilitates DNA-PKcs protein recovery. Comparison of XAV939 treatment alone to XAV939/MG132 combined treatment reveasl recovery of DNA-PKcs protein, suggesting tankyrase 1 prevents DNA-PKcs proteolytic degradation. Similar results were observed following siRNA depletion of tankyrase 1 and MG132 treatment (Figure 6).
Supplemental Figure 5. A DNA-PKcs siRNA marker Mock hours post 24 24 48 72 96 122 DNA-PKcs tankyrase 1 actin DNA-PKcs 100 98 52 1 1 <1 tankyrase 1 100 113 181 132 100 141 S5.A.DNA-PKcs siRNA knockdown does not affect tankyrase 1 protein levels. WTK1 lymphoblasts were treated with DNA-PKcs siRNA, then DNA-PKcs, tankyrase 1, and -actin protein levels, at 24, 48, 72, 96 and 122 hr after transfection, were measured by western blot. Percentages of protein remaining are shown below; all values were normalized to -actin and the mock transfection.
Supplemental Figure 5.B DNA-PKcs siRNA Mock hours post 24 24 48 72 96 122 DNA-PKcs ATM actin DNA-PKcs 100 106 57 1 1.5 <1 ATM 100 101 60 4 4 <1 S5.B.DNA-PKcs siRNA knockdown resulted in reduction of ATM protein levels. Samples from Figure S5 were also used to evaluate the levels of DNA-PKcs, ATM and -actin by western blot at the indicated times after transfection. Percentages of protein remaining are shown below; all values were normalized to -actin and the mock transfection.
Supplemental Figure 6 24 hr 48 hr marker Mock M/PI TS TS/PI TS TS/PI ATM 250 kD tankyrase 1 150 kD actin 100 100 100 99 101 101 ATM 100 100 4 4 2 16 tankyrase 1 S6.ATM protein levels are not affected by tankyrase 1 siRNA knockdown. WTK1 lymphoblasts were treated with tankyrase 1 siRNA (TS), and/or the DNA-PKcs inhibitor (PI), or the two combined (TS/PI). Western blot analysis for ATM, tankyrase 1, or -actin at 24 and 48 hr post transfection is shown. Percentages of protein remaining are shown below; all values were normalized to -actin and the mock transfection.
Supplemental Figure 7 S.7. Treatment with high concentrations of the general PARP inhibitor 3-AB (10 and 20 mM) resulted in lower levels of DNA-PKcs protein as compared to untreated controls; tankyrase 1 protein levels were not affected.
Supplemental Figure 8 S8.Spontaneous and IR-induced mutagenesis after depletion or inhibition of DNA-PKcs and/or tankyrase 1. WTK1 lymphoblasts were mock transfected (M) or treated with DNA-PKcs siRNA (PS), DNA-PKcs inhibitor Nu7026 (PN), tankyrase 1 siRNA (T), or combinations thereof i.e., DNA-PKcs siRNA plus DNA-PKcs inhibitor (PS/PN), or tankyrase 1 siRNA plus DNA-PKcs inhibitor (T/PN). Cells were irradiated with g-rays or 56Fe ions and the MFs determined three days later. Data are means of at least three independent determinations, and error bars are standard deviations.