Download
1 / 25
370 likes | 706 Views
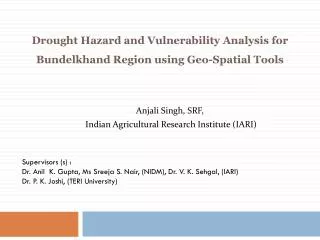
Drought Hazard and Vulnerability A nalysis for Bundelkhand Region using Geo-Spatial Tools. Supervisors (s) : Dr . Anil K. Gupta, Ms Sreeja S. Nair, (NIDM), Dr. V. K. Sehgal, (IARI) Dr . P. K. Joshi, (TERI University). Anjali Singh, SRF, Indian Agricultural Research Institute (IARI).

E N D
Drought Hazard and Vulnerability Analysis for Bundelkhand Region using Geo-Spatial Tools Supervisors (s) : Dr. Anil K. Gupta, Ms Sreeja S. Nair, (NIDM), Dr. V. K. Sehgal, (IARI) Dr. P. K. Joshi, (TERI University) Anjali Singh, SRF, Indian Agricultural Research Institute (IARI)
Objectives 1) To assess meteorological, hydrological and agricultural drought using suitable indices. 2) To identify districts exposed to extreme hazard and highly vulnerable to drought. 3) To prepare composite drought risk map for Bundelkhand region using geo-spatial tools.
Study Area • Comprises of 13 districts covering 70,000 sq. km distributed over U.P. and M.P. • It comes among the most backward region of India • Average rainfall with a range of 768 to 1087 mm • Net sown area is 3706’ 000 ha • This region faced consecutive drought since 2004-05 to 2008-09. Legend M.P. U.P.
Materials and Methods • Data acquisition • Meteorological-Monthly precipitation data from 1998 to 2009 (Indian Meteorological Department). • Hydrological-Monthly data of groundwater from 1998 to 2010 for 264 stations (Central Ground Water Board) • Agricultural-Satellite imageries from 1998 to 2009 downloaded from (www.free.vgt.vito.be/)
Materials and Methods(2) • Softwares used
Methodology -Subsetting - Agricultural mask application Phase I Meteorological Data Satellite Data Hydrological Data Pre-processed data Literature Review Selection of suitable indices Meteorological drought Agricultural drought Hydrological drought
Methodology(2) Phase II Data Analysis Frequency Intensity Chronology of drought Phase III
Meteorological Drought From 1998 to 2009 using Percent by normal Meteorological drought = f(precipitation1, precitation2......precipitation) As per Indian Meteorological Department (IMD) Deviation ≤ -19% is No drought Deviation ≥-19% - 59%≤ is Moderate drought Deviation ≥ -60% is Severe drought
Hydrological Drought Standardized Water level Index results from 1998 to 2009 Hydrological drought = f(GW1, GW2...GWn)
Hydrological Drought Pre monsoon Post monsoon Pre monsoon Post monsoon
Hydrological Drought Pre monsoon Post monsoon Pre monsoon Post monsoon
Agricultural Drought From 1998 to 2009 using NDVI and VCI Agricultural drought = f(vegetation1, vegetation2...... vegetationn)
NDVI images High Low
Trend Adjusted VCI images Legend Agricultural mask Severe drought Moderate drought Mild drought No drought
Frequency Maps *Based on number of drought occurrence over 12 years
Intensity Maps *Based on sum of deviations from the reference level
Chronology of drought • Results obtained from correlation between meteorological drought
Hazard and Vulnerability Maps *Product of frequency and intensity maps
Composite Risk Map Composite Risk = (0.35M+0.45A+0.2H) using Multi Criteria Analysis Where M= meteorology, A= agriculture, H= hydrology Ranks assigned to each class extreme=5, severe= 4, high=3, moderate= 2, mild=1
Conclusion • Meteorological Drought = Percent by normal Hydrological drought = SWI Agricultural drought = NDVI and VCI • Since 1998 there has been a gradual increase in frequency and intensity of droughts • Lalitpur district is exposed to extreme hazard. • Tikamgarh, Banda, and Mahoba were the highly vulnerable to hydrological drought. • Datia, Jhansi and Hamirpur were the highly vulnerable to agricultural drought. • Composite Drought Risk = Hazard X Vulnerability • Datia, Tikamgarh, Jhansi, Mahoba and Hamirpur are at severe drought risk