Download
1 / 32
330 likes | 542 Views
Explore social vulnerability and risk assessment using GIS in public health geographics. Understand how to create vulnerability indices for disaster preparedness and mitigation. Learn about the Social Vulnerability Index and Baseline Resilience Indicators for communities.

E N D
GIS Applications for Assessing Hazard Vulnerability and Risk Robert Gottlieb ISDH Public Health Geographics IGIC Annual Meeting May 10, 2017
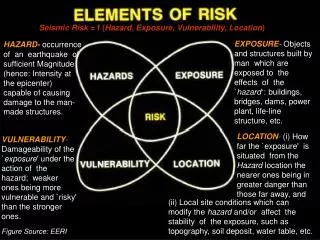
Hazard, Risk, and Vulnerability • Social vulnerability: Community’s susceptibility to harm from natural hazards (e.g. flood, tornado, extreme heat) • Vulnerability is affected by community’s characteristics • Socioeconomic factors (e.g. poverty, age, education) • Availability of preparedness resources • Community engagement • Institutional capabilities and barriers • Risk = Hazard Exposure x Vulnerability
Vulnerability Varies Spatially • Socioeconomic conditions are different in different communities • Natural hazards are different in different parts of the country • Both factors can be quantified • Can compare relative vulnerability of different places • Different components of vulnerability may be more important in different areas • Differences in vulnerability can contribute to differences in impacts • Great opportunity to use GIS
Benefits of Vulnerability Indices • Can combine a lot of information of different types to create a simpler set of numerical scores • Can use GIS to calculate and map those scores to see which communities are more vulnerable and may need more resources and attention in preparedness, emergency response, and recovery • Helps promote disaster preparedness and mitigation and identify vulnerable areas BEFORE disaster strikes • Officials and decision makers can use indices to inform decision making
Creating Vulnerability Indices • Census/American Community Survey data is most common • This can be combined with hazard, health, infrastructure, and environment information • Some indices are applicable for all hazards, some are designed for a specific hazard • Some indices could be specific to a particular sector
American Community Survey (ACS) • Census surveys every person in U.S. every 10 years (most familiar) • Starting in 2005, the Census Bureau moved many questions from the decadal Census to ACS • ACS surveys approx. 250,000 people each month • Results are used to create 1, 3, and 5 year estimates • Only the 5 year ACS has estimates for all areas • Data is updated more frequently, but it’s a sample rather than a full count
Social Vulnerability Index (SVI) • Created by Centers for Disease Control (Flanagan et al. 2011) • Census tract level for entire U.S. • 15 Census/ACS variables • Groups variables into four categories and adds category scores together • Socioeconomic Status • Household Composition • Race/Ethnicity/Language • Housing/Transportation • Scores based on percentiles • Also flags tracts that are in the 90th percentile in each variable • All data is freely available • http://svi.cdc.gov/
SVI Calculation Each tract is ranked by percentile for each of the 15 variables, the 4 components, and overall. A tract can have a flag for each of the 15 variables, 4 components, and overall. 40 total values for each tract.
Social Vulnerability Index (SoVI) • Created by University of South Carolina’s Hazards and Vulnerability Research Institute (HVRI) (Cutter et al. 2000, 2003) • County and Census tract level for entire U.S. • 29 Census/ACS variables • Uses principal component analysis to group variables differently for each analysis, and adds component scores together • Results change depending on area and scale selected • Final scores available in ArcGIS Online and ArcGIS Pro • http://webra.cas.sc.edu/hvri/products/sovi.aspx
Vulnerability Components • Race (black) and class (poverty) • Wealth • Age (old) • Ethnicity (Hispanic) • Nursing home residents • Ethnicity (Native American) • Employment in service industries
Baseline Resilience Indicators for Communities (BRIC) • Created by HVRI (Cutter et al. 2010) • Resilience is ability to withstand harm from hazards, not exact opposite of vulnerability • 49 variables grouped into six categories ahead of time • Social • Economic • Community capital • Institutional • Housing/Infrastructural • Environmental • Large number of data sources
My Hazard Vulnerability Index • Developed for my Master’s thesis at University of Oklahoma (2011) • County level for contiguous U.S. • Combined SoVI with historical data for seven natural hazards • Tornado • Severe thunderstorm winds • Hail • Hurricane winds • Storm surge • Drought • Wildfires • Multiply SoVI and hazard score together
Vulnerability Score Hazard Score
Other Applied Index Examples • Chatham County, Georiga flood vulnerability • Heat Vulnerability Index – e.g. San Francisco, Philadelphia, Toronto Wisconsin • Predicting injuries and carbon monoxide poisoning from hurricanes in Florida • Flood and asthma vulnerability indices for Illinois
FEMA Community Resilience Indicators • https://www.fema.gov/community-resilience-indicators • 28 indicators in 10 core capabilities • Housing • Health and Social Services • Economic Recovery • Infrastructure Systems • Natural and Cultural Resources • Threats and Hazards Identification • Risk and Disaster Resilience Assessment • Planning • Community Resilience • Long-Term Vulnerability Reduction
How to Use Vulnerability Metrics • Get an understanding of vulnerability BEFORE disaster • Can identify communities that may require more attention, outreach, and investigation of more detailed processes • Help these communities raise awareness, access resources, supplement efforts of local organizations • Interviews, focus groups, workshops, studies, and plans with local organizations, leaders, and subject matter experts, can provide more insight on the needs of vulnerable areas. • Building trust and collaboration takes time • Examining individual component scores, not just the overall score, can provide additional insight • They are one of many tools – no one tool tells you everything • Indices can be starting point of larger risk and vulnerability assessments • Often can’t change the index variables directly • They do not describe processes that create vulnerability
Best Practices for Creating Indices • Use data that are up to date and available for relatively similar times • Support use of variables with documented evidence • Express variables as a percentage and standardize • A simpler process will be easy to understand, but also want index to be comprehensive • GIS can help combine data available at different scales, but need to be careful about how that is done – finer scale is preferable • Weighting variables not encouraged – how to do it? • Building indices with input from more diverse stakeholders throughout process can incorporate more perspectives and promote buy-in, but it can be more difficult to build consensus
Limitations • Scores in study area are relative, not absolute • Not all people in a geographic unit are equally vulnerable • Do not ignore areas with a low vulnerability score • Consider uncertainty in data (e.g. ACS) • Verifying vulnerability is very difficult - impacts affected by hazard severity and many other factors • Can examine health outcomes and recovery time after hazard event, but unlikely to be able to show causation – too many variables • Can’t control how people will respond • Other types of assessments and incident reports will be more useful at this stage • Local knowledge and qualitative information are also very important
National Hazard Data Source Examples • Data.gov • National Weather Service (NWS) • Storm Prediction Center (SPC) • National Hurricane Center (NHC) • National Centers for Environmental Information (NCEI) • National Drought Mitigation Center (NDMC) • Homeland Infrastructure Foundation-Level Data (HIFLD)
National Socioeconomic Datasets • U.S. Census Bureau • Decadal Census • American Community Survey • County Population Estimates • Small Area Income and Poverty Estimates (SAIPE) • Small Area Health Insurance Estimates (SAHIE) • Bureau of Labor Statistics – Employment Rate
Indiana Datasets • Midwestern Regional Climate Center • STATS Indiana • Indiana Indicators • ISDH Stats Explorer and Health Resources Directory • SAVI - Polis
Volunteered Geographic Information (VGI) • People providing content that can be mapped • A form of crowdsourcing and/or crowdmapping • In this form, data contribution, collection, and curation is not limited to experts
Citizen Science • People reporting what they observe and experience to contribute to scientific projects – related to VGI • National Severe Storm Laboratory’s mPing • Smartphone app for reporting precipitation type • Community Collaborative Rain, Hail and Snow Network (CoCoRaHS) • People measure and report precipitation amount
U.S. Geological Survey Did You Feel It? • When there is an earthquake anywhere in the world, people can go to the USGS website and report where they are and how strong the shaking was. • Helps give quick idea of how strong the earthquake was and how much damage it might have done • http://earthquake.usgs.gov/earthquakes/map/
Participatory Mapping • Allows people to create their own maps • People identify what is important to them – it may not be the same as what experts have selected • Can identify issues for which data source is not available (e.g. social connectivity) • Can make participants feel more involved and empowered within community • Responses could be drawn on a paper map and digitized
Conclusions • Vulnerability and resilience indices are one tool that can help to identify communities that susceptible to harm from natural hazards. • Introduced available datasets • Discussed best practices and limitations • Other forms of spatial information can be used to assess vulnerability and risk in more detailed applications
Thank You! Questions? rgottlieb@isdh.in.gov
References • BRACE Illinois. https://braceillinois.uic.edu/ • Cutter, S.L., J.T. Mitchell, M.S. Scott, 2000. Revealing the Vulnerability of People and Places: A Case Study of Georgetown County, South Carolina, Annals of the Association of American Geographers, 90(4): 713-737. • Cutter, S.L., B.J. Boruff, W.L. Shirley, 2003. Social Vulnerability to Environmental Hazards, Social Science Quarterly, 84(1): 242-261. • Cutter, S.L., C.G. Burton, C.T. Emrich, 2010. Disaster Resilience Indicators for Benchmarking Baseline Conditions, Journal of Homeland Security and Emergency Management, 7(1), Article 51. • Cutter, S. L., K.D. Ash, C.T. Emrich, 2014. The Geographies of Community Disaster Resilience, Global Environmental Change 29:65-77. • Dunning, C.M., S. Durden. 2011. Social Vulnerability Analysis Methods for Corps Planning. U.S. Army Corps of Engineers Campaign Plan: Goal 2. 92 pp. http://www.iwr.usace.army.mil/Portals/70/docs/iwrreports/2011-R-07.pdf • Emrich, C.T., D.P. Morath, G.C. Bowser, R. Reeves. 2014. Climate-Sensitive Hazards in Florida. Identifying and Prioritizing Threats to Build Resilience against Climate Effects. http://www.floridahealth.gov/environmental-health/climate-and-health/_documents/climate-sensitive-hazards-in-florida-final-report.pdf • Evans, J.M., M. Hauer, R.D. Hardy, J.S. Pippin. 2014. Social Vulnerability and Local Hazard Mitigation Planning: Application and Evaluation of a “SoVI-Lite” Approach for Glynn County, Georgia. https://www.researchgate.net/publication/263194584. 21 pp. • Flanagan, B., E. Gregory, E. HalliseyFlanagan, B., E. Gregory, E. Hallisey, J. Heitgerd, and B. Lewis, 2011. A Social Vulnerability Index for Disaster Management. Journal of Homeland Security and Emergency Management 8(1)., J. Heitgerd, and B. Lewis, 2011. A Social Vulnerability Index for Disaster Management. Journal of Homeland Security and Emergency Management 8(1). • Georgia Emergency Management Agency. 2014. 2014 State of Georgia Hazard Mitigation Strategy. http://www.gema.ga.gov/Mitigation/Documents/Planning/2014%20GHMS.pdf. 199 pp. • Gottlieb, R. 2011. Using GIS to Assess Vulnerability to Meteorological and Climatological Hazards in the Contiguous United States. Master’s Thesis. University of Oklahoma. 116 pp. • Weber, S. Sadoff, N., Zell, E., de Sherbinin, A. 2015. Policy-relevant indicators for mapping the vulnerability of urban populations to extreme heat events: A case study of Philadelphia. Applied Geography. 63(9): 231-243. • Wisconsin Department of Health Services. 2014. Wisconsin Heat Vulnerability Index. P-00882. 14 pp. https://www.dhs.wisconsin.gov/publications/p0/p00882.pdf • Wolf, T., W. Chuang, G. McGregor. 2015. On the Science-Policy Bridge: Do Spatial Heat Vulnerability Assessment Studies Influence Policy? International Journal of Environmental Research and Public Health. 12(10): 13321-13349.