Download
1 / 22
220 likes | 374 Views
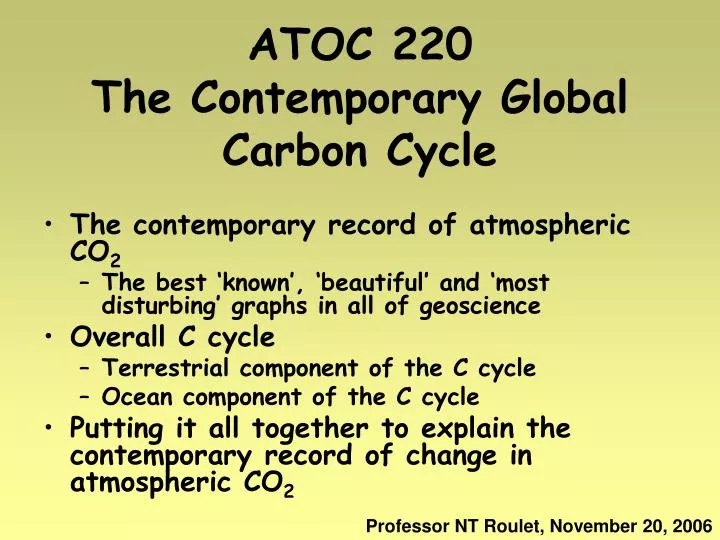
ATOC 220 The Contemporary Global Carbon Cycle. The contemporary record of atmospheric CO 2 The best ‘known’, ‘beautiful’ and ‘most disturbing’ graphs in all of geoscience Overall C cycle Terrestrial component of the C cycle Ocean component of the C cycle

E N D
ATOC 220The Contemporary Global Carbon Cycle • The contemporary record of atmospheric CO2 • The best ‘known’, ‘beautiful’ and ‘most disturbing’ graphs in all of geoscience • Overall C cycle • Terrestrial component of the C cycle • Ocean component of the C cycle • Putting it all together to explain the contemporary record of change in atmospheric CO2 Professor NT Roulet, November 20, 2006
Seasonal fluctuation in atmospheric CO2 (at Mauna Loa, Hawaii)
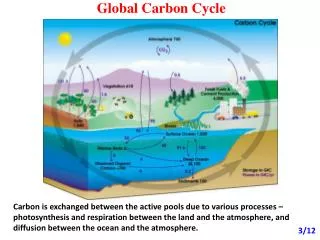
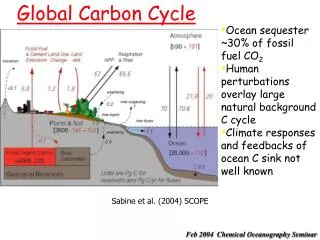
Global Carbon Cycle Sedimentary rock 40,000,000 (CaCO3) Black: pre-industrial Red: + industrial era up to ~1990 (IPCC, 2006)
inflow outflow • C is stored in different reservoirs and is • exchanged between these reservoirs. • Material enters & leaves at certain rates. • Material remains in a reservoir temporarily. • Residence time of material • Reservoir volume (at steady state) flow rate reservoir volume =
Atmosphere Primary producers Dead organic matter Consumers Soil Carbon storage & transfer in a terrestrial ecosystem
C exchange between atmosphere & terrestrial plants Atmospheric CO2 590 (751)Gt C Outflow: 60 Gt C/yr Inflow: 60 Gt C/yr Respiration & decomposition Photosynthesis 600 Gt C 1700 Gt C
C exchange between atmosphere & the terrestrial biosphere Atmospheric CO2 590 (751) Gt C Residence time of C in terrestrial biosphere reservoir size flow rate 600 (2300)Gt 60 Gt/yr = 60 Gt C/yr 60 Gt C/yr = 600 Gt C 10 (38) yrs 1700 Gt C Live terrestrial C has a residence time of ~10 yrs (total terrestrial C ~ 40 yrs)
Rondonia (Amazon) 1986 1992 1975
Forest Regrowth Pool changes were evaluated as the difference between the late 1990s and early 1980s pool estimates, pixel-by-pixel, and quoted on a per year basis. The carbon pool in the woody biomass of northern forests (1.5 billion ha) is estimated to be 61 20 Gt C during the late 1990s. Our sink estimate for the woody biomass during the 1980s and 1990s is 0.680.34 Gt C/yr. http://cybele.bu.edu/greeningearth/ge.html
The NPP Algorithm Step 1 convert absorbed radiation to optimal gross production Step 2 downgrade by climate limiting factors to obtain gpp Step 3 subtract respiration to obtain npp Trends in NPP are positive over 55% of the global vegetated area and are statistically more significant than the declining trends observed over 19% of the vegetated area. Average of interannual trends (1982-99) in growing season NPP estimated with GIMMS and PAL (v3) FPAR http://cybele.bu.edu/greeningearth/ge.html
1. The marine biological pump atmospheric CO2 Ocean surface Phytoplankton sedimentation of organic C upwelling Bacterial decomposition Nutrients CO2 Deep Ocean
2. The solubility pump CO2 Atmosphere Ocean surface CO2+ H2O H2CO3 carbonic acid H2CO3 H+ + HCO3- bicarbonate HCO3- H+ + CO32- carbonate
CO2(aq) dissociates rapidly into DIC while increasing acidity: pH K1 K2 CO2 + H2O HCO3- + H+ CO32- + 2H+ bicarbonate carbonate Bjerrum Plot:pH = 8.1T = 250C, S = 35[CO2] : [HCO3-] : [CO3=] 0.5% : 86.5% : 13% (Zeebe & Wolf-Gladrow, 2002)
The solubility pump & calcium carbonate formation CO2 Atmosphere Ocean surface CO2+ H2O H2CO3 H2CO3 H+ + HCO3- shelled organisms Ca2+ + 2HCO3- CaCO3+ H2CO3
rock weathering solubility pump Ca2+ + 2HCO3- CaCO3+ H2CO3 shelled organisms Sediments
Foraminiferans (Protozoa) • <0.5 mm in size. • live in the plankton & • in the sediments. • feed on bacteria. • produce ~1 billion tons • of CaCO3 per yr.
Coccolithophores (algae) • planktonic • produce 1.5 million tons • of CaCO3 per yr • sometimes form “blooms” • at the ocean surface which • reflect visible light SeaWiFS image 16 July 2000
C exchange between atmosphere & the ocean Atmospheric CO2 590 (751)Gt C Outflow: 70 (20) Gt C/yr Inflow: 70 (22) Gt C/yr Gas exchange Gas exchange 3 Gt C 900 Gt C
C exchange between atmosphere & the ocean Atmospheric CO2 590 (751) Gt C Residence time of C in surface ocean reservoir size flow rate 900 Gt 170 (190) Gt/yr = 70 (90) Gt C/yr 70 (90) Gt C/yr 900 Gt C 3 Gt C = 5 (4.7) yrs 11 Gt C/yr 101 Gt C/yr 90 Gt C/yr
C exchange between atmosphere & the ocean Atmospheric CO2 590 (751) Gt C One more issue How can you have more organic C export than exists in living biomass? 70 (90) Gt C/yr 70 (90) Gt C/yr 900 Gt C 3 Gt C 11 Gt C/yr 101 Gt C/yr 90 Gt C/yr
Ocean net primary production NPP g C/m2/yr Global Ocean NPP ~ 50 to 60 Gt C/yr Therefore if the living biomass is 3 Gt C it means the residence time of the plankton < a few weeks
Pulling this all together • Terrestrial system exchanging ~ 60 Gt C/yr with the atmosphere but with a definite seasonality • Ocean system exchanging ~ 90 Gt C/yr with the atmosphere of ocean NPP forms part of the uptake and solubility the rest