Download
1 / 38
390 likes | 640 Views
Global Change and the Carbon Cycle. Michael Raupach 1,3,4 , Pep Canadell 2 and Damian Barrett 2,1,4 1 CSIRO Earth Observation Centre, Canberra, Australia 2 CSIRO Plant Industry, Canberra, Australia 3 Global Carbon Project (IGBP-IHDP-WCRP-Diversitas) 4 CRC for Greenhouse Accounting

E N D
Global Change and the Carbon Cycle Michael Raupach1,3,4, Pep Canadell2 and Damian Barrett2,1,4 1CSIRO Earth Observation Centre, Canberra, Australia 2CSIRO Plant Industry, Canberra, Australia 3Global Carbon Project (IGBP-IHDP-WCRP-Diversitas) 4CRC for Greenhouse Accounting Thanks: Peter Briggs, Helen Cleugh, Mac Kirby, Rachel Law, Ray Leuning, Graeme Pearman, Peter Rayner, Steve Roxburgh, Will Steffen, Cathy Trudinger, YingPing Wangand to: AGO (Australia), NIES (Japan), and CRC for Greenhouse Accounting APN Symposium, Canberra, 23 March 2004
Outline • Carbon in the earth system • Global carbon budget • An Australian perspective • Inertia • Greenhouse mitigation • Vulnerability
Carbon in the earth system 1. Carbon is the building block of life • Forms large, reactive molecules which store and propagate information, enabling the evolutionary emergence of complex, self-organising systems • The carbon cycle is the crossroads for all major biogeochemical cycles 2. Carbon is a key to sustainable natural resource management 3. Managing the carbon cycle is key to greenhouse gas mitigation
Atmospheric CO2: past and future • Last 420,000 years:Vostok ice core record(blue) • Last 100 years:Contemporary record(red) • Next 100 years: IPCC BAU scenario(red)
Interactions between the carbon cycle and the climate system C cycle Aerosols IPCC Third Assessment (2001)
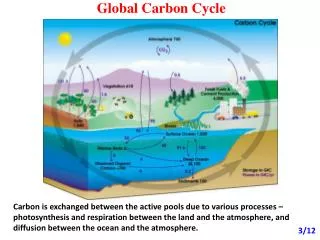
Global carbon budget • What goes in:Human contributions to enhancedatmospheric CO2 • What stays or comes out:Fate of enhancedatmospheric CO2 Data from IPCC Third Assessment (2001)
Global carbon budget 1980-1999Fluxes in GtC/year (summary from Sabine et al. 2004, SCOPE-GCP) National data Remote sensing 1980s1990s Atmospheric C accumulation 3.3 0.1 3.2 0.2 IPCC 2001 = Emissions (fossil, cement) 5.4 0.3 6.4 0.6 IPCC 2001 + Net ocean-air flux-1.9 0.5 -1.7 0.5 IPCC 2001 -1.8 0.8 -1.9 0.7le Quere et al 2003 + Net land-air flux-0.2 0.7 -1.4 0.7 IPCC 2001 -0.3 0.9 -1.2 0.8le Quere et al 2003 • Global C budget from atmospheric signals (CO2, 13C, O2) Ocean O2 flux correction • Attribution of net land-air flux Net land-air flux -0.3 0.9 -1.2 0.8 = Land use change2.0(0.9 to 2.8)2.2(1.4 to 3.0) Houghton 2003 + Residual terrestrial sink-2.3(-4.0 to -0.3)-3.4(-5.0 to -1.8) = Land use change0.6(0.3 to 0.8)0.9(0.5 to 1.4) de Fries et al 2002 + Residual terrestrial sink-0.9(-3.0 to 0)-2.1(-3.4 to -0.9)
SCOPE-GCP Rapid Assessment of the Carbon Cycle • Field CB, Raupach MR (eds.) (2004) The Global Carbon Cycle: Integrating Humans, Climate and the Natural World. Island Press, Washington D.C. 526 pp. • A joint initiative of • Scientific Committee On Problems in the Environment (SCOPE) • The Global Carbon Project (IGBP-IHDP-WCRP-Diversitas)
Interannual variability in the global C cycle Roger Francey, CSIRO Atmospheric Research
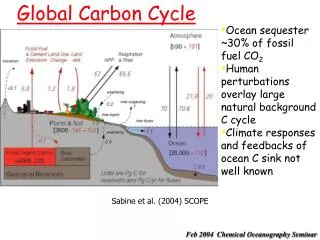
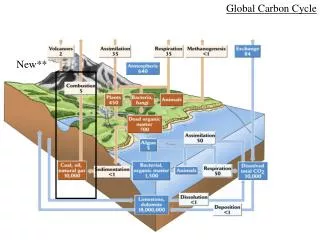
The current carbon cycle Sabine et al (2004, SCOPE-GCP)
Global carbon budget: conclusions • Main revision to IPCC Third Assessment (2001) is possible downward revision of C flux from land use change (from ~2 to ~1 PgC/y) from remote sensing evidence • This reduces magnitude of residual terrestrial sink (around −3 to −2 PgC/y) • Atmospheric accumulation has high interannual variability (more than ±2 PgC/y around a current mean of 3.2 PgC/y) • Most of this variability is attributable to the net land-air flux
An Australian perspective NBP~0 NEP~0.1 NPP~0.5 GPP=1 Dist RHet RAuto Assim • Australian NPP, NEP and NBP • Fire, Agriculture, Nitrogen --------------------------------------------------------- • Definitions: • Gross Primary Production: GPP = Photosynthetic assimilation • Net Primary Production: NPP = GPP − Autotrophic Respiration • Net Ecosystem Production: NEP = NPP − Heterotrophic Respiration • Net Biome Production: NBP = NEP − Disturbance Emission (Fire)
AVHRR-NDVI anomaly 1981-2003 • Current version (Oct 2003) uses EOC "B-PAL" archive of AVHRR data • 5 km, 8-11 day composites • Still to incorporate: • Atmos correction • BRDF correction • 1-km data • Peter Briggs, Edward KingJenny Lovell, Susan Campbell, Michael Raupach, Michael ScmidtSonja Nikolova, Dean Graetz, Tim Mc Vicar
Mean annual NPP and NEP for Australia • Large interannual variability • Mean annual NPP = 740 TgC yr-1 (range 470 – 1032) • Mean annual NEP = 0.31 TgC yr-1 (range -81 to 118) • NEP calculated without fire, so actually an estimate of NBP Xu and Barrett (2004) unpublished
Comparing predicted Australian NEP and NBP with aircraft CO2 measurements off the east coast • CO2 and NEP are in antiphase • NBP has higher amplitude than NEP • Fire acts as an alternative oxidation pathway Aircraft [CO2] over western Pacific and Australia (Matsueda et al 2002) NEP = GPP – Ra – Rh NBP = GPP – Ra –Rh – Fire emissions Xu and Barrett (2004) submitted Global Change Biology
Global NEPgC/m2/y Model-data synthesis Models: • terrestrial biosphere (BETHY) • atmospheric transport model Data: • remote sensing • atmospheric CO2 NEE uncertainty Peter Rayner, CSIRO Atmospheric Research
Estimates of Australian NPP LPJ Hybrid IBIS Triffid Miami Oz SDGVM Berry RFBN BiosEquil Grasp Miami CenW Olson VECODE Vast Century dLdP Global average NPP Evidence from: * C inventories* CO2 (Cape Grim) Roxburgh et al 2004
Effect of agriculture on Australian Net Primary Production • Australian NPP without agricultural inputs of nutrients and water • Ratio: (NPP with agric) / (NPP without agric) • Largest local NPP changes: around x 2 • Continental change in C cycle: 1.07 • Continental change in N cycle: around 2 Raupach, M.R., Kirby, J.M., Barrett, D.J., Briggs, P.R., Lu, H. and Zhang, L. (2002). Balances of water, carbon, nitrogen and phosphorus in Australian landscapes: Bios Release 2.04. CD-ROM (19 April 2002). CSIRO Land and Water.
Australian nitrogen balance and the effect of agriculture With agriculture Without agriculture N flux (kgN/m2/yr) Fert Dep FixGas Leach Disturb Raupach, M.R., Kirby, J.M., Barrett, D.J., Briggs, P.R., Lu, H. and Zhang, L. (2002). Balances of water, carbon, nitrogen and phosphorus in Australian landscapes: Bios Release 2.04. CD-ROM (19 April 2002). CSIRO Land and Water.
Comparing fluxes in the Australian and global C cycles • Averagia: a land mass of the same area as Australia, but with the same biogeochemical fluxes as the global terrestrial average -------------------------------------------------------------------------------------------------------------------- Flux Australia Averagia Mean Range Mean -------------------------------------------------------------------------------------------------------------------- NPP (MtC/y) −780 (−1032 to −470) −2850 (by area) NBP (MtC/y) −0.31 (−118 to +81) −60 (by area) NEP (MtC/y) ? (?) −105 (by area) Fire emission (MtC/y) + 107 (+77 to +142) + 45 (by area) Fossil-fuel C emission + 103 (small) + 21 (by population) Rainfall (mm) 465 770 Relative to Averagia, Australia has: • about 1/3 the NPP, but 2/3 the rainfall • negligible NBP • twice the fire emissions • over 4 times the per capita fossil fuel emission • Australian C fluxes from Xu and Barrett (2004, unpublished); global values from de SCOPE-GCP 2004 (de Fries LUC)
Inertia in the coupled carbon-climate-human system Field, Raupach and Victoria (2004, SCOPE-GCP)
Inertia in the coupled carbon-climate-human system CO2 Emissions (PgCyr-1) 650 Global temperature change 650 CO2 Concentration (ppm) 650 IPCC Third Assessment (2001) 2000 2100 2200 2300
Inertia: conclusions • Time scales (years) for system components: • Land-air C exchange 10 to 100 • Ocean-air C exchange 100 to 1000 • Economic development 20 to 200 • Technology to decarbonise energy 10 to 100 • Development of political will to act globally ? • Development of institutions ? • Stabilisation (of CO2 level or temperature) requires anthropogenic C emissions to fall eventually to near zero: this will take over a century • Temperature will continue to rise slowly (few tenths of degree per century) long after CO2 stabilisation, because of long-time-scale ocean inertia
Greenhouse mitigation • Carbon gap • Potential and actual mitigation • Ancillary effects
The carbon gapEdmonds et al. (2004, SCOPE-GCP) • The carbon gap is the difference between presently projected C emissions and the emission trajectory required for stabilisation Effect of technological development CO2 Emissions (PgCyr-1) Carbon gap
Matching C emissions to CO2 stabilisation pathways • Case 1 = "Business as usual" (IS92A) • Case 2 = Case 1 with major CO2 sequestration and disposal • Case 3 = Case 2 with major energy conservation and use of non-fossil-fuel energy SCOPE-GCP (2004)
Mitigation Potential Baseline Potential Sustainably Achievable Potential Technical Potential Uptake proportion at given cost Cost of carbon ($/tCeq) Economic factors Social and institutional factors Environmental factors 0 1 Mitigation Potential = Carbon Sequestered or GHG emissions avoided, as a fraction of technical potential mitigation • Effects of economic, environmental and social-institutional factors on the mitigation potential of a carbon management strategy SCOPE-GCP (2004)
Ancillary effects: economic, environmental and socio-cultural impacts of mitigation strategies SCOPE-GCP (2004)
Greenhouse mitigation: conclusions • Even business-as-usual projections for fossil fuel emissions include very substantial technical innovation (efficiency, reductions in fossil fuel share of energy, …) • A mix of all effective strategies is required: • Conservation • Non-fossil-fuel energy sources • Land-based options (reduction in land use change, biofuels) • Geological disposal • Achievable mitigation potential is often much less (10 to 20-% of) technical potential • Uptake of a given strategy is (presently) largely determined by ancillary benefits and costs, not greenhouse mitigation outcome
Vulnerability in the carbon cycle • Vulnerability of a C pool is the risk of accelerated carbon release from that pool as climate change occurs because of a positive feedback [d(flux)/d(climate) > 0] Fossil Fuel burning (+) Atmospheric CO2 (+) Warming (+) (+) Vulnerability of biospheric C pools (+) CO2 emissions
Vulnerable carbon pools in the 21st century Carbon in terrestrial vegetation: 650 Pg Gruber et al. (2004, SCOPE-GCP)
Vulnerability of terrestrial C sink:saturation level of terrestrial C sink depends on mechanism Sink strength Sink strength • The global terrestrial biospheric carbon sink … will increase and saturate in the future if the dominant mechanism is CO2 and N fertilisation (CO2 saturation around 600 ppm) will decrease in the near future if the dominant mechanism is regrowth and fire suppression Climate warms more rapidly than predicted Climate warms as predicted (eg Cox et al 2000) 2% 98% Sink attribution in Eastern US for 1980 to1999 (Caspersen et al. 2000)
Vulnerability of terrestrial C sink: the fire bomb • Terrestrial C sinks: for how long and at what ultimate cost? Swetnam et al.
Vulnerability in the C cycle: conclusions • Stores of ~400 PgC are at moderate risk over the next century. Release of these stores would add ~200 ppm to atmospheric CO2 concentrations. • Vulnerability increases as climate change occurs. • If CO2 fertilisation is the main mechanism for the global terrestrial sink, the sink will last for 50 to 100 yearsBUTIf the global terrestrial sink is largely due to forest regrowth and fire suppression then terrestrial sinks will disappear within a few decades.
Summary • Carbon in the earth system: • The building block of life • A key to sustainable natural resource management • Key to greenhouse gas mitigation • Carbon cycle science is rapidly improving our knowledge of • The spatial and temporal patterns (dynamics) in the C cycle • Processes, feedbacks and interactions • The connections between biophysical C cycle and human activities.