Download
1 / 15
150 likes | 330 Views
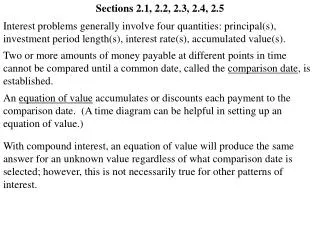
Fitting Models to Data. How Fitting! – The Least Squares Line and How Fitting! – The Least Squares Exponential. problems 2.1, 2.2 and 2.3 pages 88-92. Data Driven Models What function (linear or exponential) describes the pattern made by the following IQ data?. Data Driven Models

E N D
Fitting Models to Data How Fitting! – The Least Squares Line and How Fitting! – The Least Squares Exponential problems 2.1, 2.2 and 2.3pages 88-92
Data Driven Models What function (linear or exponential) describes the pattern made by the following IQ data?
Data Driven Models Plot data points and take a close look. Linear or Exponential or Neither ?
Data Driven Models What function (linear) best describes the pattern made by the following IQ data? m = (106-100)/15 = .40b = 100y1(t) = 100 + .4*t To measure the goodness of this model, we use the sum of the square errors (as outlined on pages 88 & 89).
Goodness of Fity1(t) = 100 + .4*t We compute the SSE. Sum of Square Errors (SSE) 0 + 0 + 16 + 16 + 29.16 + 64 = 125.16
Data Driven Models What function (linear) best describes the pattern made by the following IQ data? m = (118-113)/19 = .2631578947 y2(t) = 118 + .2631578947*(x-65) To measure the goodness of this model, we use the sum of the square errors (as outlined on pages 88 & 89).
Goodness of Fity2(t) = 118 + .2631578947*(x-65) We compute the SSE. Sum of Square Errors (SSE) .801 + 1.341 + .623 + .335 + 0 + 0 = 3.10
Goodness of Fit Compare Linear Models SSE = 125.16 SSE = 3.10
Data Driven Models How do we find the best (smallest SSE) linear model? Use Maple’s LinearFit command
Goodness of Fit y10(t) = 100.718+.269*t We compute the SSE. Sum of Square Errors (SSE) .516 + 1.561 + .613 + .279 + .007 + .037 = 3.013
Data Driven Models What function (exponential) best describes the pattern made by the following IQ data? c = 100 a = (113/100) ^ (1/46) = 1.002660438 y3(t) = 100 * (1.002660438)^t To measure the goodness of this model, we use the sum of the square errors (as outlined on pages 88 & 89).
Goodness of Fit y3(t) = 100 * (1.002660438)^t We compute the SSE. Sum of Square Errors (SSE) 0 + 3.741 + .088 + .620 + 0 + .724 = 5.173
Data Driven Models How do we find the best (smallest SSE) exponential model? Use Maple’s LinearFit command
Goodness of Fit y20(t) = 100.874 * (1.002472751)^t We compute the SSE. Sum of Square Errors (SSE) .764 + 1.739 + .399 + .425 + .000 + .194 = 3.521
Goodness of Fit CONCLUSIONS y10(t) = 100.718+.269*t with SSE: 3.013 y20(t) = 100.874 * (1.002472751)^t with SSE: 3.521 Linear Model is best! To predict IQ in 2008: y10(76) = 100.718 + .269*(76) = 121.162 HOMEWORK: See Maple Handout